
More Information
Submitted: 06 May, 2020 | Approved: 22 May 2020 | Published: 25 May 2020
How to cite this article: Eke BC, Emelue HU. Measurement of background ionizing radiation in the federal university of technology owerri, Nigeria using calibrated digital geiger counter. Int J Phys Res Appl. 2020; 3: 070-074.
DOI: 10.29328/journal.ijpra.1001025
Copyright License: © 2020 Eke BC, et al. This is an open access article distributed under the Creative Commons Attribution License, which permits unrestricted use, distribution, and reproduction in any medium, provided the original work is properly cited.

Measurement of background ionizing radiation in the federal university of technology owerri, Nigeria using calibrated digital geiger counter
Eke BC1* and Emelue HU2
1Federal University of Technology Owerri, Nigeria
2Alvan Ikoku Federal College of Education Owerri, Nigeria
*Address for Correspondence: Emelue Henry Uzoma, Department of Physics, Faculty of Science, Alvan Ikoku Federal College of Education, Owerri, Nigeria, Tel: +2347031243228; Email: [email protected]; [email protected]
The measurement of the natural ionizing radiation in the Federal University of Technology Owerri, Nigeria was carried out using a well calibrated Digital Geiger Muller counter models GCA – 04w. Measurements were taken randomly in thirty (30) diff erent locations outside the building and thirty (30) locations inside diff erent buildings in the University. Results obtained for outdoor Dose rate ranges from 0.07 μSv/hr to 0.23 μSv/hr with a mean value of 0.144 μSv/hr. While the result for the indoor dose rate ranges from 0.08 μSv/hr to 0.21 μSv/hr with a mean of 0.14 μSv/hr. The highest value recorded for the outdoor radiation is from the university front gate which is .023 μSv/hr. While the highest value recorded inside the buildings is from the School of Agriculture and Agricultural Technology (SAAT) which is 0.21 μSv/hr. All these values are lower than the world safely limits of 0.247 μSv/hr. This shows that the risk of ionizing radiation on the staff and students of the Federal University of Technology is minimal.
Natural radiation sources are classiied into two groups. The irst group is due to highly penetrating cosmic radiation mainly of glacial origin, while the second group is the terrestrial radiation from the primordial radionuclides, which have survived since the formation of the earth. The primordial radionuclides include the decay series of the radionuclides of Uranium–238 (238U) and Thorium–232 (232Th) and the single member chain of Potassium–40 (40K) [1]. The primordial radionuclides which are widespread in the atmosphere constitute about 85% of the natural background radiation received by man. Then the remaining 15% is from the cosmic radiations [2]. Long term exposure to ionizing radiation has severe health implications such as acute leukemia, lung cancer, pancreas, hepatic, skin, kidney cancers, cataracts, sterility and atrophy of the kidney [3]. In Nigeria, environmental radiation measurements started in October 1959 following the nuclear weapons testing carried out by France in Reganne in the Sahara region of Africa. This monitoring effort was motivated by the fear of likely fallout in densely populated countries in the tropical Africa [4]. The results of this exercise, which spanned for three years, showed that the highest dose to the gonads was about 20% of the average annual dose of 0.1 rem (1 mSv) to individuals from natural causes. Since then, some speciic or localized studies on radioactivity assessment in the environment have been done.
The Federal University of Technology Owerri (FUTO) was one of the institutions that were established in 1981. It moved into its permanent site (which is the location of this study) in 1993 with a land mass of about 4580 hectares. It is one of the most populous universities in the South East with a population of about forty ive thousand (45,000) people (both staff and students) [5]. The map of the study area is shown below as figure 1. Eke and Emelue has previously studied the radiation emission and health hazard implications of refuse dump site in FUTO using the sodium iodide scintillation counter [5]. This present study focused not only on the refuse dump site, but on the entire school both outdoors and indoors. Exposure to ionizing radiation over extended period is known to result in non – leather mutation, which could increase the risk of cancer [6]. There is a linear, no – threshold (LNT) relationship between radiation dose and the occurrence of cancer [7]. This dose-response hypothesis suggests that any increase in radiation dose, no matter how small, could results in an increase in cancer risk [8]. Hence the purpose of this study is to
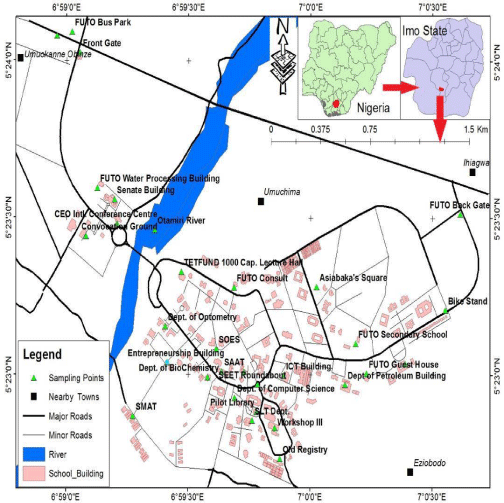
Figure 1: The map of the study area.
1. Measure the natural background radiation present in both outdoors and inside the buildings in the Federal University of Technology (FUTO).
2. To compare the values obtained with international safety limits.
3. To obtain a baseline data for future reference and more research in the area.
The natural radiation levels were assessed using the digital Geiger – Muller Counter GCA – 04 and GCA – 04W. This instrument is capable of measuring the Natural Background Radiation (NBR) rates in one count per minutes (CPM). The digital Geiger counter is a particle detector that could detect Alpha, Beta and gamma radiations (although it detects gamma ray with lower sensitivity compared to other detectors). The main elements of a digital Geiger – Muller counter is a tube which is a chamber filled with a noble gas. This tube contains two electrodes (anode and cathode) which are coated with graphite. The anode is represented by a wire in the centre of the chamber, while the cathode forms the lateral area. One end of the cylinder through which the radiation enters the chamber, is sealed by a mica window. These features make it an ideal choice for the measurement of the natural background radiation rates. Ionizing radiation coming from the surrounding medium passes through the mica window and enters the Geiger – Muller tube [9]. It ionizes the gas inside the gas chamber and transforms it into positively and negatively charged ions. The negatively charged ions migrate towards the anode, while positively charged ions accelerate to the cathode end of the detector chamber. The positively charged ions in the anode will collide with the noble gas to produce more ions through an avalanche effect. This will produce electrical impulse between the two electrodes that could be measured as radiation measurement.
The location sites for the radiation measurements were randomly selected for even distribution of the study. The Geiger–Muller counter was held at about one meter above the ground level at open and undisturbed space. At each point, the total count was recorded for 60 seconds. Two successive readings were taken at each point so that the mean could be obtained. Each count was converted to micro – sievert per hour (μSv/hr) using equation 1. [10].
1 CPM = 0.01 μSv/hr (1)
The results are presented in the tables and igures. The results for the outdoor radiation Dose rate ranges from 0.07 μSv/h to 0.23 μSv/hr as shown in table 1. The lowest measurement is 0.07 μSv/hr was recorded from the old Registry, while the highest value of 0.23 μSv/hr is from the From Gate. The mean value for the outdoor radiation measurements is 0.144 μSv/hr, and the standard deviation is 0.037 μSv/hr. The distribution of the Dose Rate values compared to the world standard values is shown in figure 2. Then the results for the indoor radiation Dose rates ranges from 0.08 μSv/hr to 0.21 μSv/hr. The lowest value of 0.08 μSv/hr from the indoor radiation measurement is from the School of Environmental Technology (SOET), while the highest value of 0.21 μSv/hr is from the School of Agriculture and Agricultural Technology SAAT. The mean value of the indoor Dose Rate is 0.140 μSv/hr while the standard deviation is 0.034 μSv/hr. The distribution of the indoor Dose rate compared to the world standard values is shown in figure 2. The values obtained for both outdoor and indoor radiation Dose rates are lower than the world standard recommended value 0.274 μSv/[12].
| Table 1: outdoor radiation Dose rates. | |||||
| S/N | Locations | CPM | Dose Rate (µSv/hr) |
||
| 1 | FUTO consult | 14 | 14 X 0.01 =0.14 | 0.00 | 0.0000 |
| 2 | Department of optometry | 13 | 13 X 0.01 =0.13 | 0.01 | 0.0001 |
| 3 | SAAT | 11 | 11 X 0.01 =0.11 | 0.03 | 0.0009 |
| 4 | Entrepreneurship building | 11 | 11 X 0.01 =0.11 | 0.03 | 0.0009 |
| 5 | SMAT | 9 | 9 X 0.01 = 0.09 | 0.05 | 0.0025 |
| 6 | SOET | 19 | 19 X 0.01 = 0.19 | 0.05 | 0.0025 |
| 7 | Department of Biochemistry | 14 | 14 X 0.01 = 0.14 | 0.00 | 0.0000 |
| 8 | Department of computer Sci | 20 | 20 X 0.01 = 0.20 | 0.06 | 0.0036 |
| 9 | Main Gate | 23 | 23 X 0.01 = 0.23 | 0.09 | 0.0081 |
| 10 | Convocation Ground | 14 | 14 X 0.01 = 0.14 | 0.00 | 0.0000 |
| 11 | Otamiri River | 20 | 20 X 0.01 = 0.20 | 0.06 | 0.0036 |
| 12 | SEET round about | 12 | 12 X 0.01= 0.12 | 0.02 | 0.0004 |
| 13 | Workshop 3 | 14 | 14 X 0.01 = 0.14 | 0.00 | 0.0000 |
| 14 | Old Registry | 7 | 7 X 0.01 = 0.07 | 0.07 | 0.0049 |
| 15 | SOSC New lecture hall | 12 | 12 X 0.01 = 0.12 | 0.02 | 0.0004 |
| 16 | FUTO entrance express road | 14 | 14 X 0.01 = 0.14 | 0.00 | 0.0000 |
| 17 | FUTO water processing building | 15 | 15 X 0.01 = 0.15 | 0.01 | 0.0001 |
| 18 | C O International conference centre | 13 | 13 X 0.01 = 0.13 | 0.01 | 0.0001 |
| 19 | TETFund 1000 capacity lecture Hall | 19 | 19 X 0.01 = 0.19 | 0.05 | 0.0025 |
| 20 | FUTO bus park | 16 | 16 X 0.01 = 0.16 | 0.02 | 0.0004 |
| 21 | FUTO primary school | 14 | 14 X 0.01 = 0.14 | 0.00 | 0.0000 |
| 22 | Asiabaka’s square | 13 | 13 X 0.01 =0.13 | 0.01 | 0.0001 |
| 23 | Bike stand | 15 | 15 X 0.01 =0.15 | 0.01 | 0.0001 |
| 24 | Petroleum building | 8 | 8 X 0.01 = 0.08 | 0.06 | 0.0036 |
| 25 | ICT building | 12 | 12 X 0.01 = 0.12 | 0.02 | 0.0004 |
| 26 | FUTO secondary sch | 18 | 18 X 0.01 = 0.18 | 0.04 | 0.0016 |
| 27 | FUTO back gate | 19 | 19 X 0.01 = 0.19 | 0.05 | 0.0025 |
| 28 | SLT | 17 | 17 X 0.01 = 0.17 | 0.03 | 0.0009 |
| 29 | FUTO guest house | 16 | 16 X 0.01 = 0.16 | 0.02 | 0.0004 |
| 30 | Pilot Library | 11 | 11 X 0.01 = 0.11 | 0.03 | 0.0009 |
|
(Outdoor mean) 0.144 µSv/hr Standard deviation = 0.037 µSv/hr World standard recommended value 0.274 µSv/hr |
|||||
| Table 2: Indoor radiation Dose rates. | |||||
| S/N | Locations | CPM | Dose Rate (µSv/hr) |
||
| 1 | Physics lab. Room 229 | 14 | 14 X 0.01 = 0.14 | 0.00 | 0.0000 |
| 2 | Ground Floor SoSe extension | 10 | 10 X 0.01 = 0.10 | 0.04 | 0.0016 |
| 3 | Drawing Studio SEET Head | 13 | 13 X 0.01 =0.13 | 0.01 | 0.0001 |
| 4 | Department of Fisheries & Aquaculture | 19 | 19 X 0.01 =0.19 | 0.05 | 0.0025 |
| 5 | Department of IMT | 12 | 12 X 0.01 =0.12 | 0.02 | 0.0004 |
| 6 | Hall of Mercy | 11 | 11 X 0.01 =0.11 | 0.03 | 0.0009 |
| 7 | 750 capacity lecture theatre | 14 | 14 X 0.01 = 0.14 | 0.00 | 0.0000 |
| 8 | FUTO Medicals | 18 | 18 X 0.01 =0.18 | ||
| 9 | Library | 17 | 17 X 0.01 =0.17 | 0.03 | 0.0009 |
| 10 | STACC | 16 | 16 X 0.01 =0.16 | 0.02 | 0.0004 |
| 11 | School of Health | 17 | 17 X 0.01 =0.17 | 0.03 | 0.0009 |
| 12 | Department of MMT | 13 | 13 X 0.01 =0.13 | 0.01 | 0.0001 |
| 13 | SOET | 8 | 8 X 0.01 =0.08 | 0.06 | 0.0036 |
| 14 | ETF SAAT | 11 | 11 X 0.01 =0.11 | 0.03 | 0.0009 |
| 15 | Senate Building | 17 | 17 X 0.01 =0.17 | 0.03 | 0.0009 |
| 16 | PRT Lecture hall | 10 | 10 X 0.01 =0.10 | 0.04 | 0.0016 |
| 17 | Biochemistry Lab. | 14 | 14 X 0.01 =0.14 | 0.00 | 0.0000 |
| 18 | SAAT Audit | 21 | 21 X 0.01 =0.21 | 0.07 | 0.0049 |
| 19 | Workshop 2 | 16 | 16 X 0.01 =0.16 | 0.02 | 0.0004 |
| 20 | SEET Lecture hall 2 | 9 | 9 X 0.01 =0.09 | 0.05 | 0.0025 |
| 21 | Department of Dental technology | 14 | 14 X 0.01 =0.14 | 0.00 | 0.0000 |
| 22 | Access Bank | 15 | 15 X 0.01 =0.15 | 0.01 | 0.0001 |
| 23 | Hostel C | 14 | 14 X 0.01 =0.14 | 0.00 | 0.0000 |
| 24 | SEET complex | 18 | 18 X 0.01 =0.18 | 0.04 | 0.0016 |
| 25 | Chemical Building | 11 | 11 X 0.01 =0.11 | 0.03 | 0.0009 |
| 26 | NDDC Hostel | 10 | 10 X 0.01 =0.10 | 0.04 | 0.0016 |
| 27 | Hostel A | 20 | 20 X 0.01 =0.20 | 0.06 | 0.0036 |
| 28 | Post Graduate Building | 9 | 9 X 0.01 =0.09 | 0.05 | 0.0025 |
| 29 | Frihub | 13 | 13 X 0.01 =0.13 | 0.01 | 0.0001 |
| 30 | Department of Physics | 16 | 16 X 0.01 =0.16 | 0.02 | 0.0004 |
|
(Indoor mean) = 0.140 µSv/hr Standard Deviation = 0.034 µSv/hr World standard recommended value 0.274 µSv/hr |
|||||
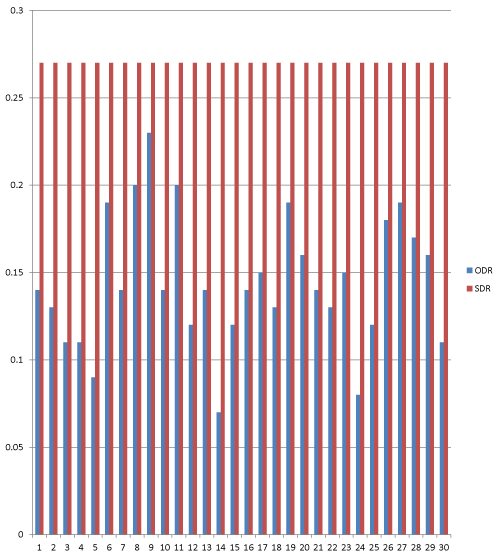
Figure 2: The outdoor Dose Rate compared to the Standard Dose Rate. ODR: Outdoor Dose Rate; SDR: Standard Dose Rate
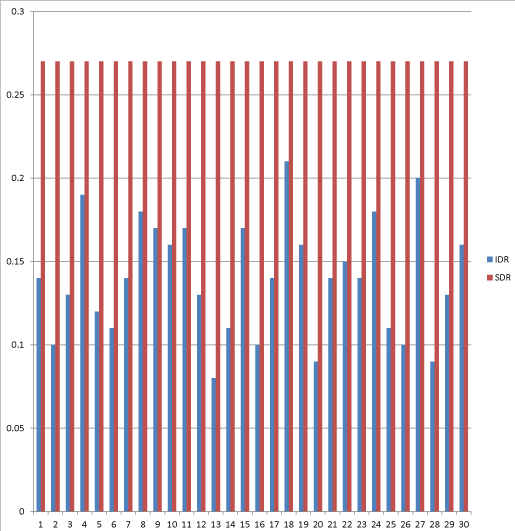
Figure 3: The indoor Dose Rate compared to Standard Dose Rate. IDR: Indoor Dose Rate; SDR: Standard Dose Rate
The in situ measurement of the natural background ionizing radiation in the Federal University of Technology Owerri, Nigeria was carried out using a well calibrated Digital Geiger Muller counter models GCA – 04w. The result of the study showed that the natural radiation levels are within the permissible levels. This is in agreement with a similar research done by [12]. However, some departments have relatively high indoor radiation levels. They should be constantly monitored, to ensure that they do not exceed the recommended permissible levels. This study could serve as bases for future reference and further research in the Federal University of Technology Owerri.
- Shetty PK, Narayana Y. Variation of radiation level and radionuclides enrichment in high background area. J Environ Radio activity, 2010: 101; 1043-1047. PubMed: https://pubmed.ncbi.nlm.nih.gov/20833457/
- United Nations Scientifi c Committee on the Eff ect of Atomic Radiation UNSCEAR. Sources and Eff ects of Ionizing Radiation UNSCEAR Report 2008.
- Taskin H, Karavus M, Ay P, Topuzoglu A, Hindiroglu S, et al. Radionuclide Concentrations in soil and lifetime cancer risk due to the gamma radioactivity in Kirklareli, Turkey. J. Environ. Rad. 2009; 100:49-53. PubMed: https://pubmed.ncbi.nlm.nih.gov/19038480/
- Obed RI, Farai IP, Jibiri NN. Population Dose Distribution due to Soil Radioactivity Concentration Levels in 18 cities across Nigeria. J Radiol Prot. 2005; 25: 305–312. PubMed: https://pubmed.ncbi.nlm.nih.gov/16286693/
- Eke BC, Emelue HU. Evaluation of Radiation Emission and Associated Health Hazards from Refuse Dumps in the Federal University of Technology Owerri, Nigeria. Current J Appl Sci Technol. 2018; 31: 1 – 9.
- Jwanbot DI. Izam MM, Gambo M. Measurement of indoor background ionizing radiation in some Science Laboratories in Jos and Ogbomosho. Nigerian J Phy. 2013; 16: 76 – 78.
- Arogunjo AM, Farai IP, Fuwape IA. Dose Rate Assessment of Terrestrial Gamma Radiation in the Delta Region of Nigeria. Radiation Protection Dosimetry. 2004: 108; 73- 77. PubMed: https://pubmed.ncbi.nlm.nih.gov/14974607/
- Brenner J. David, Sachs K. Rainer. Estimating radiation – induced cancer risk at very low doses: Rational for using a linear no – threshold approach. Radiat Environ Biophys. 2006; 44: 253–256. PubMed: https://pubmed.ncbi.nlm.nih.gov/16470411/
- Attallah MF, Awwad NS, Aly HF. Environmental radioactivity of TENORM waste produced from petroleum industry in Egypt: Review on characterization and treatment hot laboratories and waste management center, Atomic Energy Authority, Cairo, Egypt. 2002.
- Radalert 100. Nuclear Radiation Monitor Operating Manual. 12. 2007.
- Zarie KA, Al Mugren KS. Measurement of natural radioactivity and assessment of radiation hazard in soil samples from Tayma area (KSA). Isotope Radia Res. 2010; 42: 1– 9.
- Okoye PC, Avwiri GO. Evaluation of Background Ionizing Radiation Levels of Braithwaite Memorial Specialist Hospital Port Harcourt, River State. American J Scientifi c Industral Res. 2013