
More Information
Submitted: January 21, 2021 | Approved: April 03, 2021 | Published: April 05, 2021
How to cite this article: Jibiri NN, Eke BC. Radionuclide contents in yam samples and health risks assessment in Oguta oil producing locality Imo State Nigeria. Int J Phys Res Appl. 2021; 4: 006-014.
DOI: 10.29328/journal.ijpra.1001034
Copyright License: © 2021 Jibiri NN, et al. This is an open access article distributed under the Creative Commons Attribution License, which peRmits unrestricted use, distribution, and reproduction in any medium, provided the original work is properly cited.
Keywords: Natural radionuclides; Yam samples; Radiological parameters; Health risks

Radionuclide contents in yam samples and health risks assessment in Oguta oil producing locality Imo State Nigeria
Nnamdi Norbert Jibiri1 and Benedict Chukwudi Eke2*
1Department of Physics, University of Ibadan, Nigeria
2Department of Physics, Federal University of Technology, Owerri, Nigeria
*Address for Correspondence: Benedict Chukwudi Eke, Department of Physics, University of Ibadan, Nigeria, Email: [email protected]
Oguta LGA is surrounded by 44 oil wells located around different communities. Preliminary investigations indicated that crude wastes were not properly managed and oil spillage occurred regularly in the LGA. Therefore, assessment of both radionuclide contents in yam matrix and health risks in Oguta was carried out to determine possible radiological health risks associated with improper management of crude wastes, and also evaluate haematological health profile in the LGA for future reference and research. A well calibrated NaI (Tl) detector was deployed for the radiological investigation, and about 5 ml of blood samples were collected from 190 participants each from Oguta and the control LGAs for haematological assessment. Mean activity concentrations due to 40K, 226Ra and 232Th in yam samples from Oguta LGA were 189.99 ± 59.14 Bqkg-1, 23.75 ± 5.69 Bqkg-1 and 30.99 ± 9.51 Bqkg-1, respectively while mean activity concentrations due to natural radionuclides in yam samples from control LGA were 110.40 ± 78.53 Bqkg-1, 10.12 ± 3.34 Bqkg-1 and 18.39 ± 8.74 Bqkg-1 for 40K, 226Ra and 232Th, respectively. Committed effective dose equivalent values in Oguta and the control LGAs were 704.95 ± 183.30 μSvy-1 and 403.65 ± 172.19 μSvy-1, respectively which are less than world average value of 1.1 mSvy-1. Crucially, one-way ANOVA at α0.05 has indicated that effects of radiological parameters due to natural radionuclides in yam from Oguta are significantly different from effects of radiological parameters due to natural radionuclides in yam from the control LGA. However, the percentage contributions of natural radiation exposures to incidence of cancer in Oguta and the control LGAs are just 1.7% and 1.4%, respectively, and haematological investigations have shown that overall health of the communities in the study LGAs has not been compromised due to environmental and human factors. Hence, natural radioactivity may have been elevated in Oguta but the concentration levels are not yet alarming. Radiological health risks could result from consistent exposure to those natural radionuclides in the long term.
The most important sources that contribute to the radiation absorbed by human populations occur in the natural environment [1]. There is no way to avoid being exposed to these natural sources, which, in fact, cause most of the radiation exposure of the world’s population. Technologically Enhanced Natural Radiation (TENR) is used on exposure to natural sources of radiation that would not occur without, or which is increased by, some technological activity not expressly related to the radioactive nature of the materials [2]. Food and drink may contain primordial and some other radionuclides, mainly from natural sources [3]. The most predominant naturally occurring radionuclide in foodstuffs is 40K, with an average content of 0.05% in plants and 0.2% in animal tissues [4]. Ra-226 and Th-232 may also be present in foodstuffs in different concentrations. Ingestion of radionuclides through food intake accounts for a substantial part of average radiation doses to various organs of the body and also represents one of the important pathways for long term health considerations [5,6]. Oil extraction involves several contaminating processes and its wastes are categorized as Technologically Enhanced Naturally Occurring Radioactive Material (TENORM) wastes. Produced water, that is, water produced as by-product during extraction of oil and gas, is a combination of the formation water which occurs naturally in the reservoir and the water injected in the well to increase the pressure necessary for extracting oil [7]. When radium bearing produced water, scales or sludges are released to the ground, soil becomes contaminated with concentrations of radium [8]. Oguta LGA (Figure 1) had the population of 154,770 in 2018 using a 2.83% growth rate [9], and the area of 483 km2 [10]. In 1964, oil production and processing operations started in Oguta LGA, Imo State, Nigeria [11]. The operations are carried out by Shell Petroleum Development Company, Nigerian Agip Oil Company and Seplat Petroleum Development Company PLC. Following the communities concern and outcry about the health effects of oil pollution, Oguta LGA surrounded by oil wells (21 oil wells in Izombe, 6 oil wells in Awommamma, 7 oil wells in Ezi-Orsu, 7 oil wells in Orsu-Obodo and 3 oil wells in Awa) was visited. Preliminary investigations showed that there were reoccurring cases of oil spillage in Oguta. The last spillage occurred in 2019 according to [12]. Investigations also showed that the Sucker Pits used in gathering crude wastes usually overflowed during rainy season into rivers, canals and surrounding farmlands. Understanding the health impacts of low-level chronic public exposure is vital in providing a rational basis for regulating radiation exposure. [13,14] evaluated the risk arising from terrestrial gamma radiation exposure in South-East, South-West and Northern regions of Nigeria. Only soil matrix was measured and the non-oil producing capital city of Owerri, Imo State in the South-East region comprising Owerri Municipal, Owerri North and Owerri West Local Government Areas only was surveyed. Results indicate that the number of individuals at risk in Owerri capital city is 0.17 yr-1. Five years later, [15] investigated a possible relationship between the level of reported cancer cases and soil radioactivity in the six geopolitical zones in Nigeria using available cancer data from 13 cancer registries across the geo-political zones. Again, only soil matrix was measured and the non-oil producing capital city of Owerri, Imo State in the South-East zone comprising Owerri Municipal, Owerri North and Owerri West Local Government Areas only was surveyed. Results also indicate that cancer cases from the South-East zone attributable to radiation exposure due to soil radioactivity are about 2.4% of the total reported cases in the zone. According to [16], the loss of source of livelihood was rated very serious because the oil producing LGA had been denied of the limited farmlands and water sources for crop cultivation, fishing and marine activities due to pollution and other inimical practices by oil companies which operate in the area. Since oil production and processing operations started in Oguta LGA, the level of natural gamma radiation dose in food matrices has not been determined and no attempt has been made to assess possible radiological health risks associated with improper management of crude wastes. Hence, this study was designed to determine the natural radionuclide concentrations levels in yam, cultivated within Oguta oil producing LGA, and also evaluate possible health risks in the LGA linked to unprofessional handling of crude wastes. The outcome of this study could be used to address the communities concern with respect to overall health of residents. For the choice of control LGA, Mbaitoli (Figure 2) with the population of 258,212 in 2018 [9] and the area of 204 km2 [10] was chosen because the LGA hosts no chemical nor other industrial activities in Imo State.
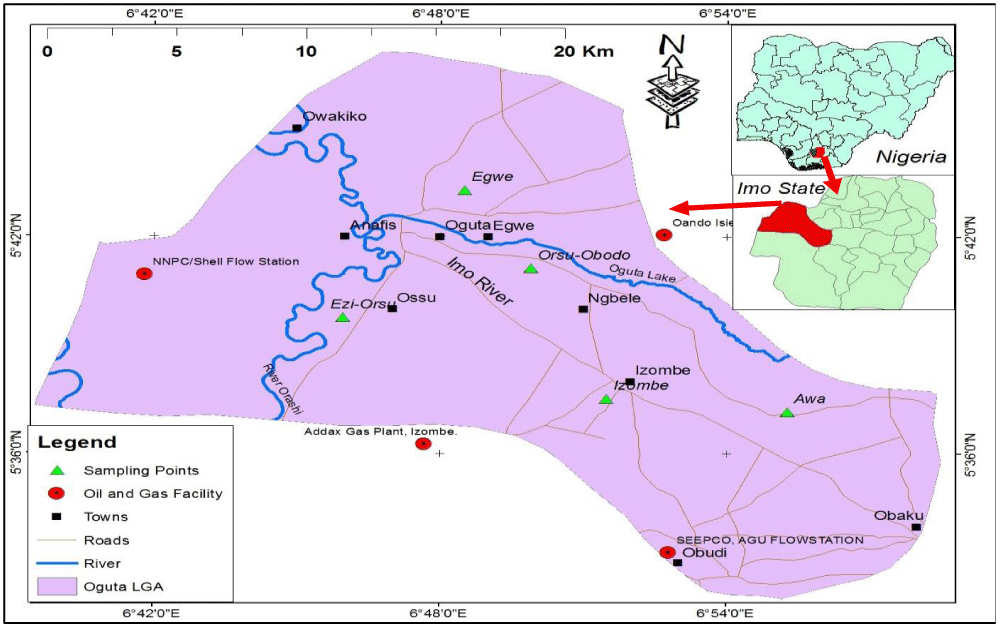
Figure 1: Map of Oguta LGA.
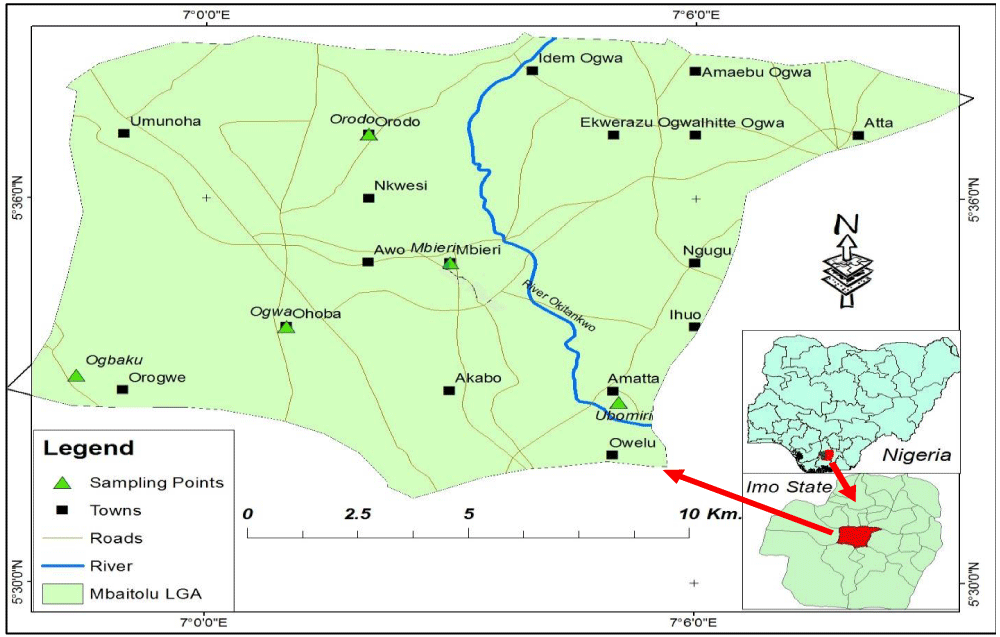
Figure 2: Map of Mbaitoli LGA.
Sample collection and preparation
The sampling LGAs have rural population whose diet is based mainly on consumption of tubers such as yam. The sampling was done during harvesting period in order to collect samples directly from Oguta and Mbaitoli farmlands. Yam (Dioscorea specie) samples were collected from five different farms in different communities in each LGA. The samples collected from various farms were packed in polythene bags and transported to the Radiation and Health Physics Laboratory, University of Ibadan, Nigeria for preparation prior to gamma spectroscopic analysis. Yam tubers were peeled. The edible parts were sliced and dried at room temperature until a constant mass was achieved. The dried samples were pulverised, homogenized and sieved with a 2.0 mm mesh sieve. The sieved yam samples were transferred into empty cylindrical plastic containers of uniform size (60 mm height by 65 mm diameter) and sealed for a period of about 30 days. This was done to achieve secular radioactive equilibrium between the natural radionuclides and their respective progenies prior to gamma spectroscopy. Due to limited space of the detector shield, only 200g of the yam samples was used for analysis. The samples of yam collected from different communities in each LGA are presented in table 1 for Oguta and Mbaitoli.
| Table 1: Samples of yam (Dioscorea specie) collected from the study LGAs. | ||
| LGAs | Communities | Number of samples |
| Oguta | Izombe | 7 |
| Ezi-Orsu | 5 | |
| Orsu-Obodo | 7 | |
| Awa | 9 | |
| Egwe | 8 | |
| Mbaitoli | Mbieri | 11 |
| Ubomiri | 7 | |
| Orodo | 5 | |
| Ogwa | 5 | |
| Ogbaku | 8 | |
Radioactivity measuring system
The system for the radioactivity measurements was a lead-shielded 76 mm × 76 mm NaI (Tl) detector (Model No. 802-series, Canberra Inc.) coupled to a Canberra Series 10+ Multichannel Analyzer (MCA) (Model No. 1104) through a preamplifier base. The MCA is a complete system having all the functions needed for spectroscopic analysis. The energy calibration was performed in order to relate channel numbers to gamma-rays energy in MeV. After a pre-set counting time of 1000 s, the channels of the various photo peaks corresponding to known gamma energies were identified. The efficiency calibration was to convert the area under photo peak to concentration of the radionuclides in units of Bqkg-1. The detection efficiency of the spectrometer used in this study was determined by using standard sources. The detector had a resolution of about 8% at 0.662 MeV, which was capable of distinguishing the gamma ray energies of the radionuclides of interest in this study. The photons emitted by the samples would sufficiently be discriminated if their emission probability and their energy were high enough and the surrounding background continuum was low enough. The photo peak at 1.460 MeV was used for the measurement of 40K while those at 1.760 MeV from 214Bi and at 2.614 MeV from 208Tll were used for the measurement of 226Ra (238U) and 232Th, respectively. The detection limit (DL) of a measuring system describes its operating capability without the influence of the sample. The DL given in Bqkg-1, which is required to estimate the minimum detectable activity in a sample, was obtained using [17].
(1)
where Cb is the net background count in the corresponding peak, Tb is the background counting time in second, , ɛ is the detector efficiency at the specific gamma-ray energy, Pγ is the absolute transition probability of the specific gamma ray and Ms is the mass of the sample (kg). With the measurement system used in the present study, the detection limits obtained for yam samples were 4.15 Bqkg-1, 1.00 Bqkg-1 and 1.43 Bqkg-1 for 40K, 226Ra and 232Th, respectively. Any activity concentration values below these numbers were taken in this study as being below detection limit (BDL) of the detector. Each sample was placed symmetrically on top of the detector and measured for a period of 10 h (36,000 s). The net area under the corresponding peaks in the energy spectrum was computed by subtracting counts due to Compton scattering of higher peaks and other background sources from the total area of the peaks. From the net area, the activity concentrations in the samples were obtained using the expression [18,19].
(2)
where C is the activity concentrations of the radionuclide in the sample given in Bqkg-1, Cn is the count rate under the corresponding peak, ɛ is the detector efficiency at the specific gamma-ray energy, Pγ is the absolute transition probability of the specific gamma ray and Ms is the mass of the sample (kg).
Committed effective dose rate due to ingestion of yam
Radiation doses ingested were obtained by measuring radionuclide activities in yam (Bqkg-1) and multiplying those measured values by the masses of yam consumed over a period of time (kgd-1 or kgy-1). A dose conversion factor (SvBq-1) was then applied to give an estimate of ingested dose. The ingested dose was calculated using the equation [20].
(3)
Equation (3) can be rewritten as:
(4)
where i denotes a food group, the coefficients denote the consumption rate in kgy-1 and activity concentration of the radionuclide in Bqkg-1, respectively, and gt,r is the dose coefficient for intake by ingestion of radionuclide r in SvBq-1. The values of g for 40K, 226Ra, and 232Th are 5.9 x 10⁻⁹ SvBq-1, 4.8 x 10⁻⁸ SvBq-1 and 2.3 x 10⁻⁷ SvBq-1, respectively, for adult members of the public [21-23]. The consumption rate for yam in Nigeria according to [24] is 75.15 kgy-1 per capita. For the purpose of this study, it was assumed that all yam was consumed at the point of production and the required amount of yam was produced in the given location.
Assessment of cancer risks due to natural radiation exposures
From the direct or Linear-No-Threshold (LNT) probability between effective dose and probability of effects for low-level doses, it follows that the collective detriment G, on N people is directly proportional to the collective effective dose resulting from an exposure [15]. That is:
G = RKSE (5)
where SE is the collective effective dose equivalent, RK is the constant of proportionality referred to as the total risk factor. It has been determined from data on epidemiological studies that the value of RK is 16.5 x 10⁻³ Sv-1 [15] and
SE = Effective Dose Equivalent × Population (6)
The incidence of a particular health burden such as cancer in a population is a function of population size. To eliminate the factor of population size when risk was related to other factors, the collective detriment G was computed in a fixed population size of 105 [15]. Hence, the normalized collective detriment GNis:
(7)
Haematological assessment
Probing further to address the communities concern, haematological profiling was carried out in Oguta LGA. Haematological assessment could be used to evaluate the overall health of communities and equally detect a wide range of disorders. Haematological profiling in communities offers the opportunity to document present conditions in order to scientifically assess future conditions due to other external factors such as human activities. The sample size of 190 participants was determined using [25]. The participants were selected from similar five communities. A multi-stage sampling technique, which included purposive sampling technique and systematic sampling technique, was adopted. For minimum duration of residency, minors and young adults (≤ 29 years old) who had been resident for at least five years in Oguta were eligible. Adults (≥ 30 years old) who had been resident for at least thirty years in Oguta were eligible. However, employees in oil and gas companies residing within Oguta were excluded because they might have increased occupational exposure. Again, for the choice of control LGA, Mbaitoli was selected. Similar profiling was carried out in the control LGA.
Laboratory procedure for haematological assessment
About 5 ml of blood sample was collected from each participant, and blood collection was handled with expertise and due aseptic precaution. The blood samples collected into Ethyl Diathamine (EDTA) bottles were used for the determination of haematological parameters at Silver Press Laboratory, Owerri. The Neubauer counting chamber was used in Red Blood Cell (RBC) count after the addition of RBC diluting fluid as described by [26]. The Neubauer counting chamber was used in White Blood Cell (WBC) count after the addition of Turk solution as described by [26]. The Platelet (Plt) was also counted using the Neubauer counting chamber. The results from RBC, WBC and Plt counts were compared with normal values (Table 2). The differential white blood cell was counted manually after smearing the Leishman’s stained drop of blood onto a glass slide as described by [27]. The neutrophils (N), lymphocytes (L), basophils (B), monocytes (M) and eosinophils (E) were determined. The results from differential white cell count were compared with normal values (Table 3).
| Table 2: Normal values of white blood cell, red blood cell and platelet counts [28]. | ||
| Test | Unit | Normal value |
| White blood cell count | x103/mm3 | 5-10 |
| Red blood cell count | x106/mm3 | 4.2-6.1 |
| Platelet count | x103/mm3 | 150-450 |
| Table 3: Normal values of differential white cell count [29]. | |
| Test | Normal value (%) |
| Neutrophils count | 50-70 |
| Eosinophils count | 1-4 |
| Basophils count | 0.5-1.0 |
| Monocytes count | 2-8 |
| Lymphocytes count | 20-40 |
Activity concentrations (Bqkg-1) due to 40K, 226Ra and 232Th in yam samples from the study LGAs
The range and mean activity concentrations due to the natural radionuclides in yam samples from Oguta and Mbaitoli LGAs are presented in table 4. From Table 4, the measured activity concentrations due to 40K, 226Ra and 232Th in yam samples from Oguta oil producing LGA range from 103.56-308.88 Bqkg-1, 11.50-33.22 Bqkg-1 and 12.41-47.62 Bqkg-1 with mean values of 189.99 ± 59.14 Bqkg-1, 23.75 ± 5.69 Bqkg-1 and 30.99 ± 9.51 Bqkg-1, respectively while the activity concentrations due to 40K, 226Ra and 232Th in yam samples from Mbaitoli LGA range from 5.24-247.09 Bqkg-1, 4.12-19.05 Bqkg-1 and BDL-29.47 Bqkg-1 with mean values of 110.40 ± 78.53 Bqkg-1, 10.12 ± 3.34 Bqkg-1 and 18.39 ± 8.74 Bqkg-1, respectively. Substantially, mean activity concentrations due to natural radionuclides in yam samples from Oguta are about twice the mean activity concentrations due to natural radionuclides in yam samples from Mbaitoli LGA, which may be ascribed to some level of contamination in Oguta. Mean activity concentrations due to 40K, 226Ra and 232Th in yam samples from this study compared to other studies in Nigeria are presented in table 5. From the table, mean activity concentrations due to the radionuclides in yam from the present study are comparable to activity concentrations from other studies conducted in other parts of the country for 40K.
| Table 4: Range and mean activity concentrations (Bqkg-1) due to 40K, 226Ra and 232Th in yam samples from the study LGAs. | |||||
| LGAs | Communities | 40K | 226Ra | 232Th | |
| Izombe | Mean ± σ | 246.66 ± 77.27 | 20.06 ± 2.21 | 33.99 ± 8.69 | |
| Range | 140.52 - 308.88 | 17.07 - 22.12 | 23.13-44.38 | ||
| Ezi-Orsu | Mean ± σ | 224.63 ± 26.11 | 26.39 ± 4.91 | 32.91 ± 3.33 | |
| Range | 192.37 - 255.40 | 22.07 - 33.22 | 28.72-36.85 | ||
| Oguta | Orsu-Obodo | Mean ± σ | 162.90 ± 31.65 | 27.59 ± 3.21 | 35.89 ± 15.11 |
| Range | 138.54 - 207.07 | 23.39 - 30.45 | 14.55-47.62 | ||
| Awa | Mean ± σ | 157.39 ± 28.81 | 27.01 ± 2.25 | 30.90 ± 5.10 | |
| Range | 137.62 - 199.67 | 23.64 - 28.29 | 25.78-37.91 | ||
| Egwe | Mean ± σ | 158.35 ± 63.67 | 17.72 ± 7.14 | 21.25 ± 7.53 | |
| Range | 103.56 - 233.02 | 11.50 - 24.96 | 12.41-28.32 | ||
| Overall Mean ± σ | 189.99 ± 59.14 | 23.75 ± 5.69 | 30.99 ± 9.51 | ||
| Overall Range | 103.56 - 308.88 | 11.50 - 33.22 | 12.41-47.62 | ||
| Mbieri | Mean ± σ | 66.74 ± 62.17 | 11.18 ± 2.98 | 12.87 ± 7.91 | |
| Range | 14.48 - 141.14 | 7.67 - 14.94 | 7.83-24.57 | ||
| Ubomiri | Mean ± σ | 157.93 ± 41.69 | 9.93 ± 2.79 | 17.77 ± 8.66 | |
| Range | 127.43 - 218.37 | 5.79 - 11.87 | 9.69-27.81 | ||
| Mbaitoli | Orodo | Mean ± σ | 50.38 ± 46.57 | 9.51 ± 1.43 | 22.95 ± 6.01 |
| Range | 5.24 - 115.29 | 7.54 - 10.76 | 14.64-28.77 | ||
| Ogwa | Mean ± σ | 61.25 ± 40.72 | 6.95 ± 2.96 | 11.30 ± 7.62 | |
| Range | 36.72 - 122.12 | 4.12 - 10.13 | BDL-17.82 | ||
| Ogbaku | Mean ± σ | 215.70 ± 35.60 | 13.02 ± 4.06 | 27.05 ± 3.95 | |
| Range | 171.98 - 247.09 | 10.29 - 19.05 | 21.16-29.47 | ||
| Overall Mean ± σ | 110.40 ± 78.53 | 10.12 ± 3.34 | 18.39 ± 8.74 | ||
| Overall Range | 5.24 - 247.09 | 4.12 - 19.05 | BDL-29.47 | ||
| Table 5: Mean activity concentrations due to 40K, 226Ra and 232Th in yam samples from the study areas compared to other studies in the country. | ||||
| Country | Mean activity concentrations (Bqkg-1) | Reference | ||
| 40K | 226Ra | 232Th | ||
| Present study (Oguta LGA) | 189.99 | 23.75 | 30.99 | Present study |
| Present study (Mbaitoli LGA) | 110.40 | 10.12 | 18.39 | Present study |
| Nigeria (Jos-Plateau) | 684.5 | 85.5 | 89.8 | [20] |
| Nigeria (Abeokuta) | 490.67 | 9.60 | ND* | [30] |
| Nigeria (Osun State) | 37.84 | 1.72 | 2.24 | [31] |
| Nigeria (Jos-Plateau) | 22.12 | 2.32 | 3.24 | [32] |
| Nigeria (Onne, Rivers State) | 227.0 | 6.5 | 8.4 | [33] |
| Nigeria (Ondo State) | 81.87 | 4.67 | 3.07 | [34] |
| * Not detected. | ||||
Aactivity concentrations due to 226Ra in yam obtained from Oguta are higher than mean activity concentrations due to 226Ra in yam obtained from Mbaitoli, and those obtained by [30-34] from other parts of the country, which may be related to the activities of oil companies, such as improper management of crude wastes, in Oguta. However, higher activity concentrations were determined by [20] from a tin mining area in Jos-Plateau, Nigeria for 226Ra compared to this study. The mean activity concentrations due to 232Th in yam samples obtained from Oguta are also higher than those obtained from Mbaitoli and those obtained by [30-34] from other parts of the country, which may also be related to the activities of oil companies in Oguta. Again, [20] obtained higher activity concentrations from a tin mining area in Jos-plateau, Nigeria for 232Th compared to this study.
Committed effective dose equivalent due to radionuclides in yam samples
The Committed Effective Dose Equivalents (CEDEs) due to natural radionuclides in yam samples from the study areas are summarized in table 6. The CEDEs reported in this study due to radionuclides in yam range from 302.00 - 1000.00 µSvy-1 and 53.00 - 650.00 µSvy-1 with mean values of 704.95 ± 183.30 µSvy-1 and 403.65 ± 172.19 µSvy-1 for Oguta and Mbaitoli LGAs, respectively.
| Table 6: CEDE (μSvy-1) due to 40K, 226Ra and 232Th in yam samples from the study LGAs. | |||
| LGAs | Communities | CEDE (μSvy-1) Yam |
|
| Izombe | Mean ± σ | 767.50 ± 179.70 | |
| Range | 520.00 - 950.00 | ||
| Ezi-Orsu | Mean ± σ | 762.50 ± 49.92 | |
| Range | 710.00 - 830.00 | ||
| Oguta | Orsu-Obodo | Mean ± σ | 792.75 ± 271.34 |
| Range | 410.00 - 1000.00 | ||
| Awa | Mean ± σ | 700.00 ± 82.87 | |
| Range | 640.00 - 820.00 | ||
| Egwe | Mean ± σ | 502.00 ± 150.50 | |
| Range | 302.00 - 630.00 | ||
| Overall mean ± σ | 704.95 ± 183.30 | ||
| Overall range | 302.00 - 1000.00 | ||
| Mbieri | Mean ± σ | 292.50 ± 165.60 | |
| Range | 190.00 - 540.00 | ||
| Ubomiri | Mean ± σ | 412.50 ± 135.00 | |
| Range | 300.00 - 570.00 | ||
| Mbaitoli | Orodo | Mean ± σ | 455.00 ± 112.69 |
| Range | 310.00 - 580.00 | ||
| Ogwa | Mean ± σ | 248.25 ± 133.79 | |
| Range | 53.00 - 340.00 | ||
| Ogbaku | Mean ± σ | 610.00 ± 49.67 | |
| Range | 540.00 - 650.00 | ||
| Overall mean ± σ | 403.65 ± 172.19 | ||
| Overall range | 53.00 - 650.00 | ||
Again, the mean CEDE due to natural radionuclides in yam samples from Oguta LGA is about twice the mean CEDE due to radionuclides in yam samples from Mbaitoli. However, the CEDEs from the study LGAs are less than the world average value of 1.1 mSvy-1 [35].
Cancer risks estimation due to natural radiation exposures
Importantly, years 2000 to 2015 cancer registry data indicated that Oguta and Mbaitoli LGAs had 69 y-1 and 48 y-1 reported cases, respectively [36]. However, the expected cancer cases in this study from consumption of yam are 1.16 y-1 and 0.66 y-1, for Oguta and Mbaitoli, respectively. Hence, the percentage contributions of natural radiation exposures to incidence of cancer in Oguta and Mbaitoli are 1.7% and 1.4%, respectively.
Haematological estimations
The haematological estimations on participants from the study LGAs in Imo State, Nigeria are summarized in table 7. One hundred and ninety participants per LGA were recruited for the study. In Oguta LGA, 136 (72%) were male while 54 (28%) were female. In Mbaitoli LGA, 124 (65%) were male while 66 (35%) were female. Mean ages of participants were 33 years and 34 years in Oguta and Mbaitoli LGAs, respectively. Moreover, WBC counts in Oguta and Mbaitoli LGAs range from (5.00 - 29.87)x103/mm3 with a mean of (9.00 ± 4.82)x103/mm3 and (5.01 - 21.95)x103/mm3 with a mean of (7.78 ± 2.17)x103/mm3, respectively. Also, in Oguta and Mbaitoli LGAs, RBC counts range from (1.52 - 6.00)x106/mm3 with a mean of (4.64 ± 1.22)x106/mm3 and (1.69 - 6.00)x106/mm3 with a mean of (5.03 ± 0.74)x106/mm3, respectively. Again, in Oguta and Mbaitoli LGAs, Platelet counts range from (103 - 448)x103/mm3 with a mean of (246 ± 101)x103/mm3 and (109-450)x103/mm3 with a mean of (271 ± 97)x103/mm3, respectively. Furthermore, neutrophil counts in Oguta and Mbaitoli LGAs range from 38.2% - 70.0% with a mean of 55.7 ± 7.0% and 44.1% - 70.0% with a mean of 57.1 ± 5.6%, respectively while lymphocyte counts range from 20.9% - 51.2% with a mean of 36.8 ± 6.9% and 20.2% - 46.9% with a mean of 34.5 ± 5.7%, respectively. In Oguta and Mbaitoli LGAs, basophil counts range from 0.0% - 3.0% with a mean of 0.7 ± 0.4% and 0.0% - 3.0% with a mean of 0.7 ± 0.5%, respectively while monocyte counts range from 2.0% - 8.0% with a mean of 4.5 ± 1.5% and 2.2% - 8.0% with a mean of 5.1 ± 1.3%, respectively. Essentially, eosinophil counts in Oguta and Mbaitoli range from 1.0% - 4.0% with a mean of 2.3 ± 0.8% and 1.0% - 4.0% with a mean of 2.6 ± 0.8%, respectively. Mean WBC and Platelet counts in this study compared to other studies worldwide are presented in Tables 8 and 9, respectively. From Table 8, abnormally higher WBC counts were obtained by [37] and [38] in India, [39], [40] and [41] in Iraq, and [42] in Pakistan compared to this study, which could indicate leukaemia in those studies. From Table 9, the mean Platelet counts on participants in this study are higher than those obtained by [37] and [38] in India, [39] and [40] in Iraq, and [42] in Pakistan, which could also indicate leukaemia in those studies. Hence, the overall health of the communities in Oguta and Mbaitoli study LGAs has not been compromised due to environmental and human factors.
| Table 7: Haematological estimations in the study LGAs. | ||
| Oguta | Mbaitoli | |
| LGA | LGA | |
| Number of participants | 190 | 190 |
| Age during examination (years) | ||
| Mean | 33 | 34 |
| Standard deviation | 15 | 18 |
| Range | 10-70 | 5 - 80 |
| Sex | ||
| Male | 136 (72%) | 124 (65%) |
| Female | 54 (28%) | 66 (35%) |
| WBC count (x103/mm3) | ||
| Mean | 9.00 | 7.78 |
| Standard deviation | 4.82 | 2.17 |
| Range | 5.00-29.87 | 5.01 - 21.95 |
| RBC count (x106/mm3) | ||
| Mean | 4.64 | 5.03 |
| Standard deviation | 1.22 | 0.74 |
| Range | 1.52-6.00 | 1.69 - 6.00 |
| Platelet count (x103/mm3) | ||
| Mean | 246 | 271 |
| Standard deviation | 101 | 97 |
| Range | 103-448 | 109 - 450 |
| N (%) | ||
| Mean | 55.7 | 57.1 |
| Standard deviation | 7.0 | 5.6 |
| Range | 38.2-70.0 | 44.1 - 70.0 |
| L (%) | ||
| Mean | 36.8 | 34.5 |
| Standard deviation | 6.9 | 5.7 |
| Range | 20.9-51.2 | 20.2 - 46.9 |
| B (%) | ||
| Mean | 0.7 | 0.7 |
| Standard deviation | 0.4 | 0.5 |
| Range | 0.0-3.0 | 0.0 - 3.0 |
| M (%) | ||
| Mean | 4.5 | 5.1 |
| Standard deviation | 1.5 | 1.3 |
| Range | 2.0-8.0 | 2.2 - 8.0 |
| E (%) | ||
| Mean | 2.3 | 2.6 |
| Standard deviation | 0.8 | 0.8 |
| Range | 1.0-4.0 | 1.0 - 4.0 |
| Table 8: Mean WBC count in this study compared to other studies worldwide. | ||
| Country | WBC count (x103/mm3) Mean (Range) |
Reference |
| Present study (Oguta LGA) | 9.00 ± 4.82 (5.00 - 29.87) | Present study |
| Present study (Mbaitoli LGA) | 7.78 ± 2.17 (5.01 - 21.95) | Present study |
| North India | 21.54 ± 7.29 (NA*) | [37] |
| India | 53.8 (10 - 97) | [38] |
| Pakistan | 57.4 ± 44.41 (0.7 - 550.6) | [42] |
| Iraq | 35.37 ± 34.40 (NA*) | [39] |
| Iraq | 34.546 ± 39.015 (2.700 - 193.000) | [40] |
| Iraq | 47.1 ± 71.7 (0.5 - 450) | [41] |
| * Not applicable | ||
| Table 9: Mean platelet count in this study compared to other studies worldwide. | ||
| Country | Platelet count (x103/mm3) Mean (Range) |
Reference |
| Present study (Oguta LGA) | 246 ± 101 (103 - 448) | Present study |
| Present study (Mbaitoli LGA) | 271 ± 97 (109 - 450) | Present study |
| North India | 148.40 ± 32.67 (NA*) | [37] |
| India | 63.3 (32 - 83) | [38] |
| Pakistan | 54.5 ± 28.27 (2 - 436) | [42] |
| Iraq | 72.43 ± 79.00 (NA*) | [39] |
| Iraq | 39.963 ± 43.709 (5.000 - 250.000) | [40] |
| * Not applicable. | ||
Analysis of variance on radiological parameters
Using one-way ANOVA at α0.05, the effects of activity concentrations (Bqkg-1) and committed effective dose equivalents (μSvy-1) due to 40K, 226Ra and 232Th in yam matrix from Oguta are significantly different from the effects of radiological parameters due to natural radionuclides in similar matrix from Mbaitoli. Hence, natural radioactivity may have been elevated in Oguta LGA due to activities of oil companies in the area such as improper management of crude wastes.
The assessment of both radionuclide contents in yam matrix and health risks in Oguta LGA was carried out to determine possible radiological health risks associated with improper management of crude wastes, and also address the communities concern as regards overall health of residents. Yam samples from five different communities in the study LGAs were prepared and measured using calibrated gamma spectrometer. The mean activity concentrations from Oguta LGA were 189.99 ± 59.14 Bqkg-1, 23.75 ± 5.69 Bqkg-1 and 30.99 ± 9.51 Bqkg-1 for 40K, 226Ra and 232Th, respectively while those from Mbaitoli LGA were 110.40 ± 78.53 Bqkg-1, 10.12 ± 3.34 Bqkg-1 and 18.39 ± 8.74 Bqkg-1 for 40K, 226Ra and 232Th, respectively. Also, the mean CEDEs from Oguta and Mbaitoli study LGAs were 704.95 ± 183.30 μSvy-1 and 403.65 ± 172.19 μSvy-1, respectively. Besides, at α0.05, the effects of radiological parameters due to the natural radionuclides in yam samples from Oguta are significantly different from effects of radiological parameters due to the natural radionuclides in yam samples from Mbaitoli. However, the percentage contributions of natural radiation exposures to incidence of cancer in Oguta and Mbaitoli are just 1.7% and 1.4%, respectively, and haematological estimations have shown that overall health of the communities in the study LGAs has not been endangered. Hence, natural radioactivity might have been elevated in Oguta LGA due to improper management of crude wastes by oil companies in the area but the concentration levels are not yet frightening. Nevertheless, consistent exposure to those radionuclides may result in radiological health risks in the long run. The activities of oil companies in Oguta have to be reviewed by relevant government agencies in order to forestall long term health risks.
The authors are thankful to the staffers of Silver Press Laboratory, Owerri for providing all necessary support.
Funding
This work was supported by the Federal Government of Nigeria through the Tertiary Education Trust Fund (TETF Fund) Special Intervention, 2014.
Consent
As per international standard, each participant’s written consent has been collected and preserved by the authors.
Ethical approval
Authors have obtained all necessary ethical approval from University of Ibadan, Nigeria/University College Hospital, Ibadan, Nigeria (UI/UCH) Ethics Committee and the
Approval/assigned number is: UI/EC/17/ 0262.
- Bastos RO, Pascholati EM. Environmental gamma radiation in Municipalities of Eastern of Sao Paulo State, Brazil. Terrae. 2005; 2: 37-45.
- Mokobia CE, Adebiyi FM, Akpan I, Olise FS, et al. Radioassay of prominent Nigerian fossil fuels using gamma and TXRF spectroscopy fuel. 2006; 85: 1811-1814.
- UNEP (United Nations Environment Programme): Radiation effects and sources. 2016.
- Hewitt Cn. Radioactivity in the environment, pollution: causes, effects and control, Harrison RM (ed.), The Royal Society of Chemistry. 1990.
- McDonald P, Jackson D, Leonard DRP, McKay K. An assessment of 210Pb and 210Po terrestrial foodstuffs from regions of potential technological enhancement in England and Wales. J Environ Radiat.1999; 43: 15-29.
- Fernandez G, Rodriquez IM, Castro GV, Carrazana G, Martizez RN. Radiological surveillance of foods and drinking water in the Cuban Republic, Proceeding of the 11th Conference of the International Radiation Protection Association (IRPA), Madrid, Spain. 2004.
- Vegueria SFJ, Godoy JM, Miekeley N. Environmental impact studies of oil-field offshore platforms. Brazil J Environ Radioact. 2002; 62: 29-38.
- Smith KP, Blunt DL, Williams GP, Arnish JJ, Pfingston M, et al. An assessment of the disposal of petroleum industry NORM in non-hazardous Landfills. National Petroleum Technology Office, US Department of Energy Report No-DOE/BC/W-31-109-ENG-38-8. 1999.
- NPC (National Population Commission): National Population Census Figures, Abuja, Nigeria. 2006.
- ISMLS (Imo State Ministry of Lands and Survey): Imo State Ministry of Lands and Survey Publication. 2009.
- Okodili N. The other side of Imo oil tale. The Nation. 2014.
- Owuamanam JA. Imo community threatens to shut oil firm for neglect. Daily Trust. 2019.
- Farai IP, Jibiri NN. Baseline studies of terrestrial outdoor gamma dose rate levels in Nigeria. Radiat Prot Dosim. 2000; 88: 247-254.
- Jibiri NN. Assessment of health risk levels associated with terrestrial gamma radiation dose rates in Nigeria. Environ Int. 2001; 27: 21-26. PubMed: https://pubmed.ncbi.nlm.nih.gov/11488386/
- Farai IP, Obed RI, Jibiri NN. Soil radioactivity and incidence of cancer in Nigeria. J Environ Radioact. 2006; 90: 29-36. PubMed: https://pubmed.ncbi.nlm.nih.gov/16859817/
- Akhionbare AE, Osuji EE. Effect of oil exploration on socio-cultural issues in Oguta Local Government Area of Imo State. Nigeria J Environ Issues Agric Dev Ctries. 2013; 5: 19-24.
- Jibiri NN, Emelue HU. Soil radionuclide concentrations and radiological assessment in and around a refining and petrochemical company in Warri, Niger Delta, Nigeria. J Radiol Prot. 2008; 28: 361-368. PubMed: https://pubmed.ncbi.nlm.nih.gov/18714134/
- Olomo JB, Akinloye MK, Balogun FA. Distribution of gamma-emitting natural radionuclides in soils and water around nuclear research establishments, Ile-Ife, Nigeria. Nucl Instrum Method. 1994; 353: 553-557.
- Akinloye MK, Olomo JB. The measurement of the natural radioactivity in some tubers cultivated in farmlands within the Obafemi Awolowo University Ile-Ife, Nigeria. Nig J Phys. 2000; 12: 60-63.
- Jibiri NN, Farai IP, Alausa SK. Estimation of annual effective dose due to natural radioactive elements in ingestions of foodstuffs in tin mining area of Jos-Plateau, Nigeria. J Environ Radioact. 2007; 94: 31-40. PubMed: https://pubmed.ncbi.nlm.nih.gov/17337103/
- ICRP (International Commission on Radiological Protection): Dose co-efficient for the intakes of radionuclides by workers (ICRP Pub. No. 68), Pergamon Press. Oxford. 1994.
- ICRP (International Commission on Radiological Protection): Age-dependent doses to members of the public from intake of radionuclides: Part 5, Compilation of ingestion and inhalation dose co-efficient (ICRP Pub. No. 72), Pergamon Press, Oxford. 1996.
- RIFE (Radioactivity in Food and the Environment): The center for environment, fisheries and aquaculture science (CEFAS), Radioactivity in food and the environment, 2004 Report. RIFE-10. 2005.
- FOS (Federal Office of Statistics Nigeria): Compilation of FOS/FAO annual consumption data/food balance sheet of Nigeria, A publication of Federal Office of Statistics (FOS), Nigeria. 2006.
- Bamgboye EA. Sample size determination, in: A comparison of medical statistics, third ed. Folbam Publishers. Ibadan. 2008: 156.
- Dacie JV, Lewis SM. Practical haematology, Churchill Livingstone, London. 1991: 50-56.
- Osim EE, Akpogomeh BA, Ibu JO, Eno AE. Experimental physiology manual, Department of Physiology, University of Calabar, Calabar, third ed. 2004; 60-81.
- ACS (American Cancer Society): Understanding your lab test results, 2017.
- AACC (American Association for Clinical Chemistry): Understanding your tests, 2012.
- Jibiri NN, Abiodun TH. Effects of food diet preparation techniques on radionuclide intake and its implications for individual ingestion effective dose in Abeokuta, Southwestern Nigeria. World J Nucl Sci Technol. 2012; 2: 106-113.
- Nwankpa AC. Determination of food crops contamination in Osun State, Nigeria due to radium-226, thorium-232 and potassium-40 concentrations in the environment. Eur J Sustain Dev. 2017; 6: 169-174.
- Jwanbot DI, Izam MM, Nyam GG. Radioactivity in some food crops from high background radiation area on the Jos-Plateau, Nigeria. J Nat Sci Res. 2012; 2: 76-79.
- Avwiri GO, Agbalagba EO. Assessment of natural radioactivity, associated radiological health hazards indices and soil-to-crop transfer factors in cultivated area around a fertilizer factory in Onne, Nigeria. Environ Earth Sci. 2014; 71: 1541-1549.
- Gilbert AI, Olanrewaju A, Olawale IA, Aremu RO, Omosebi IAA. Measurement of (40K, 238U and 232Th) and associated dose rates in soil and commonly consumed foods (vegetables and tubers) at Okitipupa, Ondo State, Southwestern Nigeria. Asian J Res Rev Phys. 2018; 1: 1-11.
- IARC (International Agency for Research on Cancer): IARC monographs on the evaluation of carcinogenic risks to humans, Ionizing Radiation, Part 1: x- and γ-radiation and neutrons. 2000; 75.
- Cancer Registry Unit, University of Nigeria Teaching Hospital (UNTH) Enugu, 2016.
- Sharma M, Sachdeva MUS, Bose P, Varma N, Varma S, et al. Haematological profile of patients with mixed-phenotype acute leukaemia from a tertiary care centre of North India. Indian J Med Res. 2017; 145: 215-221. PubMed: https://pubmed.ncbi.nlm.nih.gov/28639598/
- Ghosh S, Shinde SC, Kumaran GS, Sapre RS, Dhond SR, et al. Hematologic and immunophenotypic profile of acute myeloid leukaemia: an experience of Tata Memorial Hospital. Indian J Cancer. 2003; 40: 71-76. PubMed: https://pubmed.ncbi.nlm.nih.gov/14716122/
- Hasan KM, Al-Allawi NAS, Badi AIA. Multilineage dysplasia in Iraqi Kurds with acute myeloid leukaemia: a retrospective study on 105 patients. Duhok Med J. 2017; 11: 1-10.
- Pouls RK, Shamoon RP, Muhammed NS. Clinical and haematological parameters in adult AML patients: a four year experience at Nanakaly Hospital for blood diseases. Zanco J Med Sci. 2012; 16: 199-203.
- Salim BW, Jalal SD. Immunological profile of acute myeloid leukaemia in Kurdistan Iraq. Duhok Med J. 2018; 12: 1-12.
- Sadiq MA, Shamshad GU, Ali, N, Ghani, E, Ahmed, S, Arshad, M. Haematological manifestations and frequency of FAB subtypes in patients of acute myeloid leukaemia: single centre study. Pak Armed Forces Med J. 2015; 65: 610-615.