
More Information
Submitted: March 29, 2023 | Approved: April 17, 2023 | Published: April 18, 2023
How to cite this article: Kim SG. Forensic seismology vis-à-vis an underwater explosion for the Roks Cheonan sinking in the Yellow Sea of the Korean Peninsula. Int J Phys Res Appl. 2023; 6: 073-089.
DOI: 10.29328/journal.ijpra.1001054
Copyright License: © 2023 Kim SG. This is an open access article distributed under the Creative Commons Attribution License, which peRmits unrestricted use, distribution, and reproduction in any medium, provided the original work is properly cited.
Keywords: Reverberation; Bubble pulse; Bubble jet; ROKS Cheonan; LCM, NLL, BEM

Forensic seismology vis-à-vis an underwater explosion for the Roks Cheonan sinking in the Yellow Sea of the Korean Peninsula
So Gu Kim*
Korea Seismological Institute, Goyang, 10332, Republic of Korea
*Address for Correspondence: So Gu Kim, Korea Seismological Institute, Goyang, 10332, Republic of Korea, Email: [email protected]
Most underwater explosions show characteristics of a bubble pulse and reverberation effects. To specifically identify the cause of an underwater explosion, it is most important to find a bubble pulse and reverberation effects using spectral and cepstral analyses. For a very shallow underwater explosion, spectral analysis is preferable to cepstral analysis. Time-domain analyses show bubble pulses as well as positive polarities of the first P-wave arrivals on the vertical component, and frequency-domain spectral analyses also clearly reveal the bubble pulse and reverberation effects. This study includes comparative studies including a Russian underwater nuclear explosion and US Navy shock trials. The ROKS Cheonan sinking was a shallow underwater explosion that occurred near the surface showing a bubble jet characteristic resulting in splitting the ship into two pieces including a bubble pulse and reverberation effects. The findings of a bubble jet and a toroidal bubble deformation including a bubble pulse are highlighted for a shallow underwater explosion in this study. The ROKS Cheonan sinking took place off the Baengnyeong Island in the Yellow Sea of the Korean Peninsula at a depth of about 8 m in the sea depth of 44 m on March 26, 2010. The explosive charge weight was estimated at 136 kg TNT which is equivalent to one of the abandoned land control mines (LCM) that were deployed near the Northern Limited Lines (NLL) in the Yellow Sea in the late 1970s.
The underwater explosion (UWE) incident vis-à-vis the ROKS Cheonan took place off the Coast of Baengnyeong Island in the Yellow Sea of the Korean peninsula on March 26, 2010 (Figure 1). Considerable efforts have been devoted to estimating the net explosive weight of this UWE using spectral analysis and analytical approaches including the boundary element method (BEM) [1-3]. It is also attempted to estimate and interpret the source depth and a net explosive weight using underwater acoustics (hydroacoustics) as well as infrasound records.
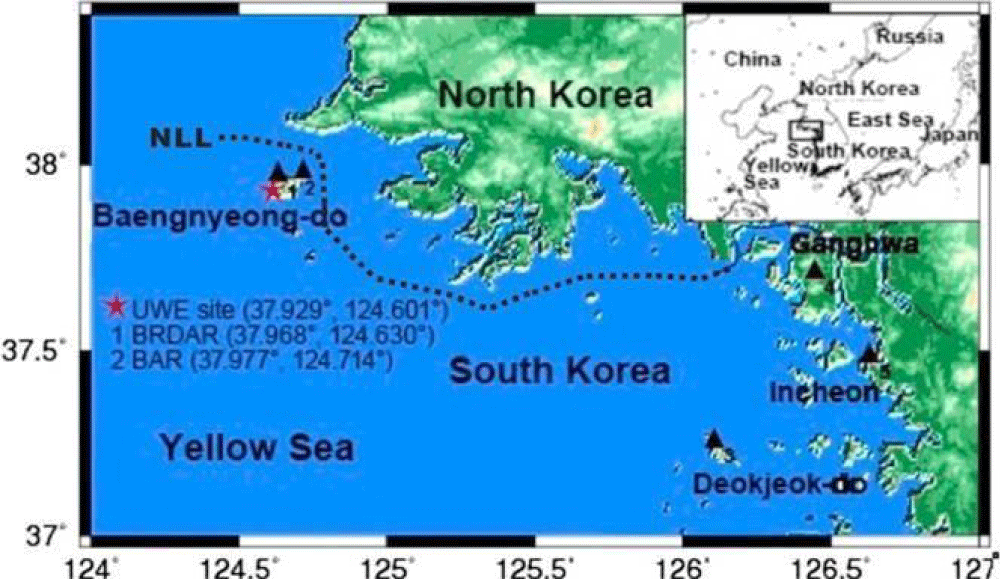
Figure 1: Map of the UWE site and seismic stations in and near Baengyeong-do in the Yellow Sea of the Korean Peninsula. The red star and black triangles indicate the UWE site and seismic stations including an infrasound array. 1 and 2 represent seismic stations in Baengnyeong-do for KIGAM (Korea Institute of Geoscience and Mineral Resources) with BRDAR infrasound array and KMA (Korea Metrological Administration). 3 and 4 represent seismic stations run by KMA and station 5 is INCN run by IRIS [1-3].
This study presents new finding methods of an underwater explosion using a bubble pulse, a bubble jet, and a toroidal bubble deformation from the high-resolution spectra as well as in the detailed time domain for an underwater explosion. The source depth and explosive charge weight estimated are verified using a ray-trace model in the shallow channel.
Scientific data analysis for the ROKS Cheonan sinking
It was possible to determine the direction of a back azimuth (BAZ) of the incident site by measuring the positive polarity on the vertical component and the first arrival amplitudes on the horizontal components (HHE and HHN) in the time domain of the seismograms shown in Figure 2. The above seismograms and accelerograms are the most important evidence that the ROKS Cheonan sinking was due to an underwater explosion, i.e. the seismological record could be the “smoking gun” in investigating the cause of the ROKS Cheonan Sinking. P, S, BP, BJ, PP, LR, SW, LQ, and T-phase indicate the first of P- and S-wave arrivals, gas bubble pulse, bubble jet, peak pressure, Rayleigh waves, and probably Stoneley waves [7] at sea bottom - seabed interface which follows Rayleigh waves on the vertical (HHZ) and E-W (HHE) components. T waves (T-phase of the tertiary wave) following Love waves (LQ) are observed on the N-S (HHN) component (tangential), which propagate in the channel waves with the group velocity of the sound velocity (1500 m/sec) with periods less than 1 sec in the ocean [8]. Stoneley waves [7] travel along a solid-fluid interface as a tube wave on the vertical component, originally along the walls of a fluid-filled borehole with a low frequency and lower velocity than the T-phase. Love waves may be due to the shearing force of the bubble jet at 5 m portside splitting the ship into two parts in the NS direction so that the tangential motion can be recorded on the N-S component (HHN).
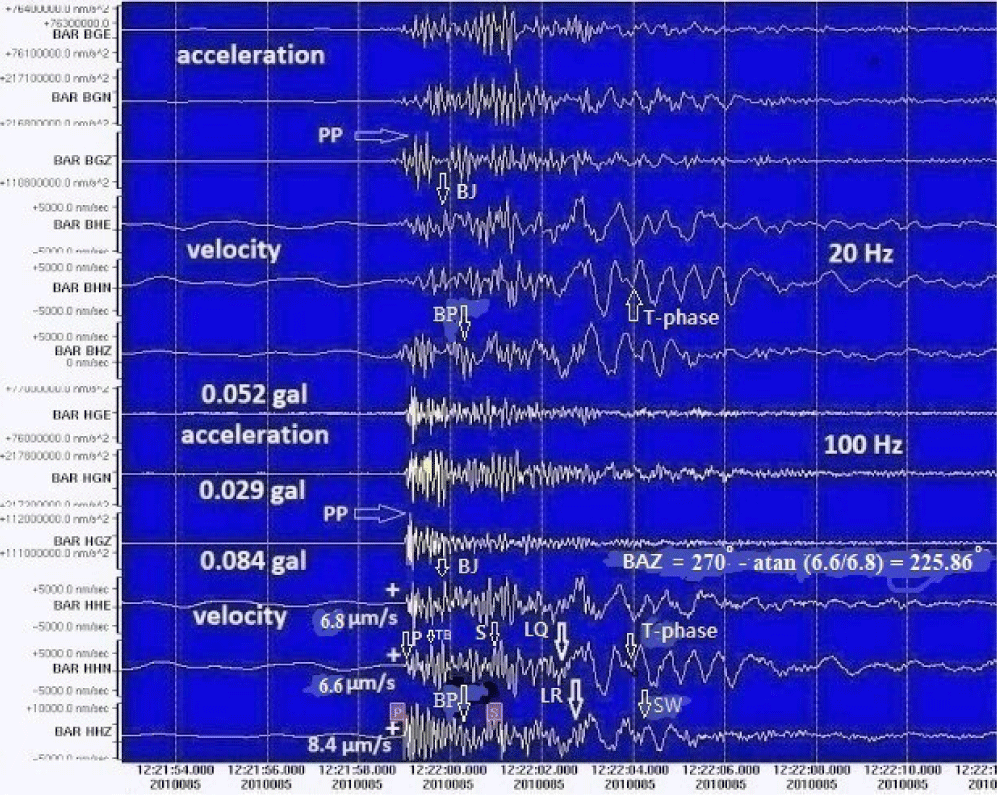
Figure 2: Seismogram and accelerogram showing the velocity (µm/sec) and acceleration (g) that were recorded with 20 and 100 SPS (samples per second) for the underwater explosion of ROKS Cheonan at the Baenyeong Island station (BAR, KMA) in the Yellow Sea of the Korean Peninsula [4,5]. The polarities (+), the arrow marks for bubble pulses (BP), bubble jets (BJ) and P- (P). S- (S), Love (LQ), Rayleigh (LR) [6], Stoneley (SW) [7], T (T-phase) [8] waves, and a back azimuth (BAZ) are presented. The indistinct scale lebels on the left are not used in this study. The only measured amplitude scales are clearly shown for the first P-wave arrivals for velocity and acceleration records.
It should be noted that a back azimuth of the site location can be calculated by measuring the first arrival amplitudes (μm/sec) of the vertical component and two horizontal components of N-S (HHN) and E-W (HHE) components (Figure 3). Taking into account the vector resultant of the first arrival amplitudes of N-S and E-W components it is possible to estimate the angle between two vector components by measuring atan [AE(HHE)/AN(HHN)] in Figure 3 and Eq. (1). The compressional motions of the first P-wave arrivals on the vertical component indicate that the source is in the opposite pushing towards the station. As a result, the back azimuth (BAZ) and location of the incident site can be determined using only the 3-component single station [4,5] from Eqs. (1) and (2).
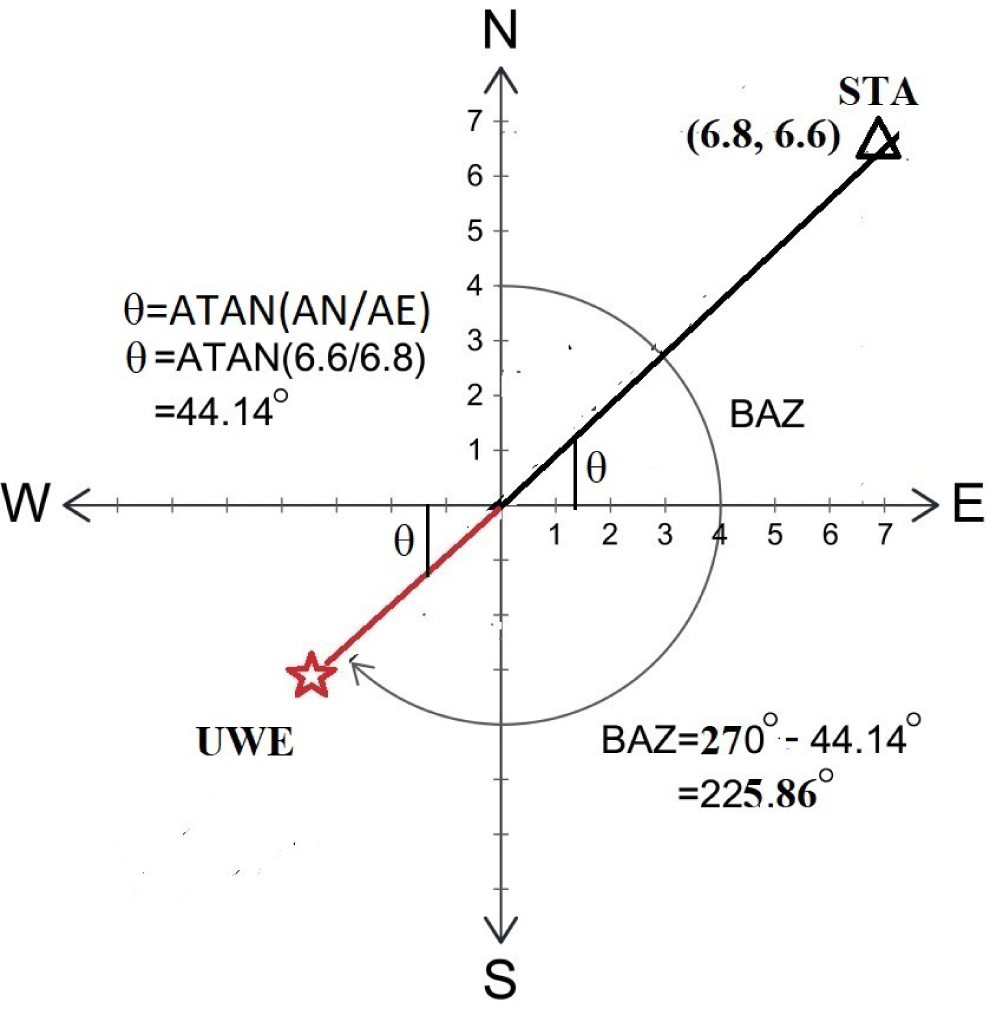
Figure 3: Determination of the direction of a site of the underwater explosion using the vector resultant of the first-arrival amplitudes (AN and AE) from two horizontal components of N-S and E-W and the positive motion of the first arrival on the vertical component. The positive first P- wave arrival on the vertical component means that the source is in the opposite to the station (+).
BAZ = 270° - atan (6.6/6.8) = 225.86° (1)
The epicentral distance from the station using travel times of P and sound waves can be estimated at 11-13 km as follows:
2 s x (≈ 6.5 km/sec) ≈ 13 km from the seismic record (Figure 2)
33 s x 0.34 km/sec = 11.22 km from the air-wave record (Figure 4) (2)
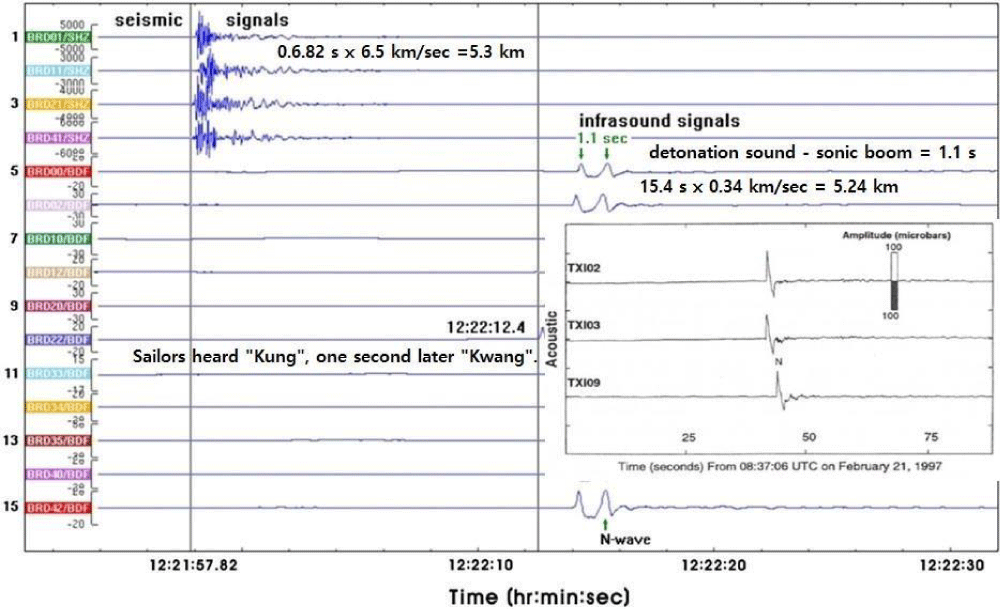
Figure 4: The infrasound records for the ROKS Cheonan Sinking on March 26, 2010. The inner figure shows seismic precursors to space shuttle fronts from the sound pressure N-wave recorded on 21 February 1997 as the STS-82 shuttle mission passed over the TXAR array [17].
The finding of BAZ at 226° from the station is in good agreement with the incident site [3,5]. The higher amplitude of the first P-wave arrival on the vertical component than that on the horizontal components shows that the upward compressional motion by an explosion occurred in the water. A shallow underwater explosion beneath a ship results in very complicated phenomena associated with buoyancy and Bjerknes forces [3,9-11] including the Archimedes principle, conservation of angular momentum, and the counter-clockwise vortex [12,13] due to Coriolis force in physics. The larger amplitudes of Love waves may be also due to the splitting of the ship into two pieces. The maximum acceleration and velocity of 0.084 gals and 8.4 µm/sec are recorded on the Z-components about 13 km away from the epicenter. Furthermore, it is also verified that the event may be an underwater explosion by observing the rarefaction motion (downward) of a bubble pulse phase (BP) and a bubble jet (BJ) peak in the time domain (Figures 2 and 5).
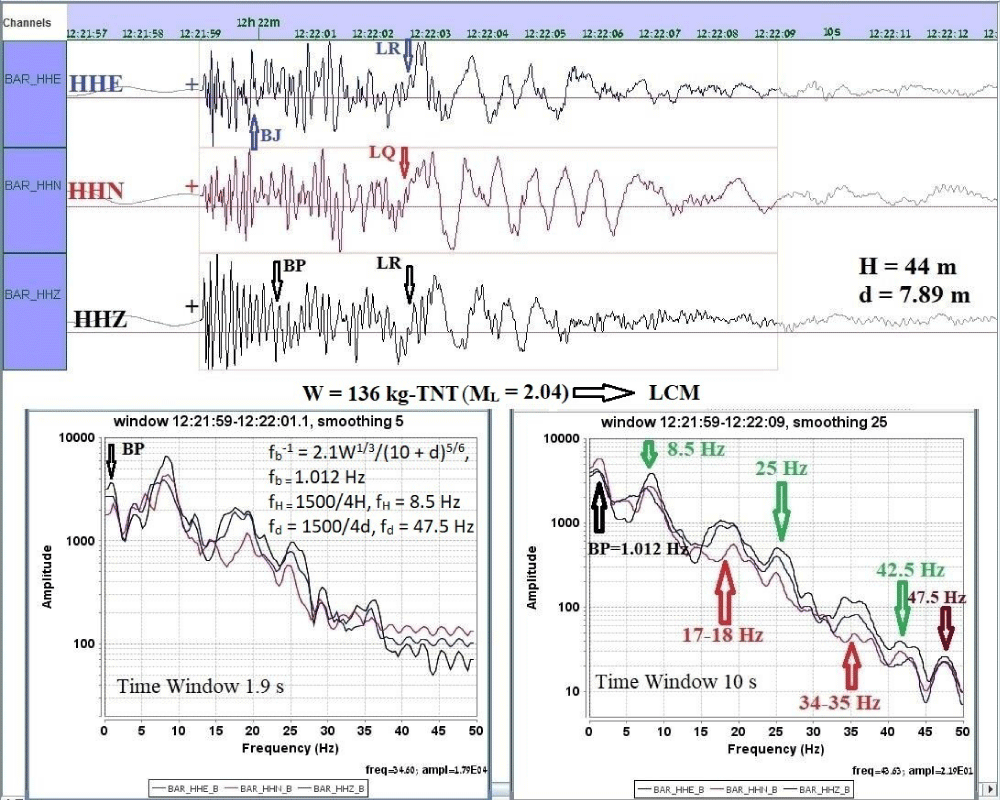
Figure 5: The positive (+) first motion of P-wave arrivals and the clear advent of a bubble pulse (BP) and a bubble jet (BJ) as well as Rayleigh (LR) and Love (LQ) waves in the time domain (upper) and spectral characteristic frequencies of 3-component spectra in the frequency domains (lower) at the BAR station comparing a short time window (1.9 s) with a long time window (10 s). The black arrows, red upward arrows, green downward arrows, and brown downward arrows indicate a bubble pulse frequency, reverberation frequencies from the bottom and reflection from the hull, and the reverberation frequency from the free surface, respectively.
In the spectral analyses (Figure 5), the fundamental bubble pulse frequency fb and its spectral harmonic series are explained in the following part, 4. Magnitude ‒ Charge Weight Relationships. The characteristic phenomena of an underwater explosion are clearly revealed as a bubble pulse (BP) and reverberation effects (green downward arrows and a strong downward brown arrow) including reflection frequencies from the hull of the ship (upward red arrows) which appear on the vertical and radial (E-W) components due to the property of P-wave propagation. The left spectra with a 1.9 s time window do not include every spectral characteristic like the right spectra with a 10.0 s time window due to the lack of higher multiple frequencies (See left spectra in Figure 5).
The reverberation frequency fH is as follows:
fH = V0/4H, fnH = (2n-1) fH n = 1, 2, …. (3)
Where V0 is the wave speed (≈1500 m/s) in the water, and H is the depth of water medium by Eq. (3).
H = 1500/(4 x 8.5) = 44.12 m ≈ 44 m (Figure 5).
Figure 5 shows the first bubble pulse (black arrow, 1.012 Hz) in the spectra, which is revealed at the high-resolution spectra in Figure 6, reverberation frequencies (upward red arrows, 8.5 Hz, 25 Hz and 42.5 Hz; fH), reflected P-wave arrivals from the hull bottom (downward green arrows, ≈ 17-18 Hz and ≈ 34-35 Hz) which are multiple frequencies of a series of the first and the second harmonic series with spectral nulls, and a shallow guide wave (downward brown arrow, 47. 5 Hz; fd ) which is also revealed in the ray-tracing modeling in Figure 7. The cutoff frequency associated with the detonation depth (47.5 Hz) can be also used to estimate the detonation depth (7.89 m). The finding of very low frequency at around 2 Hz for the T-phase is noticeable on the N-S component in the time domain in Figures 2 and 5.
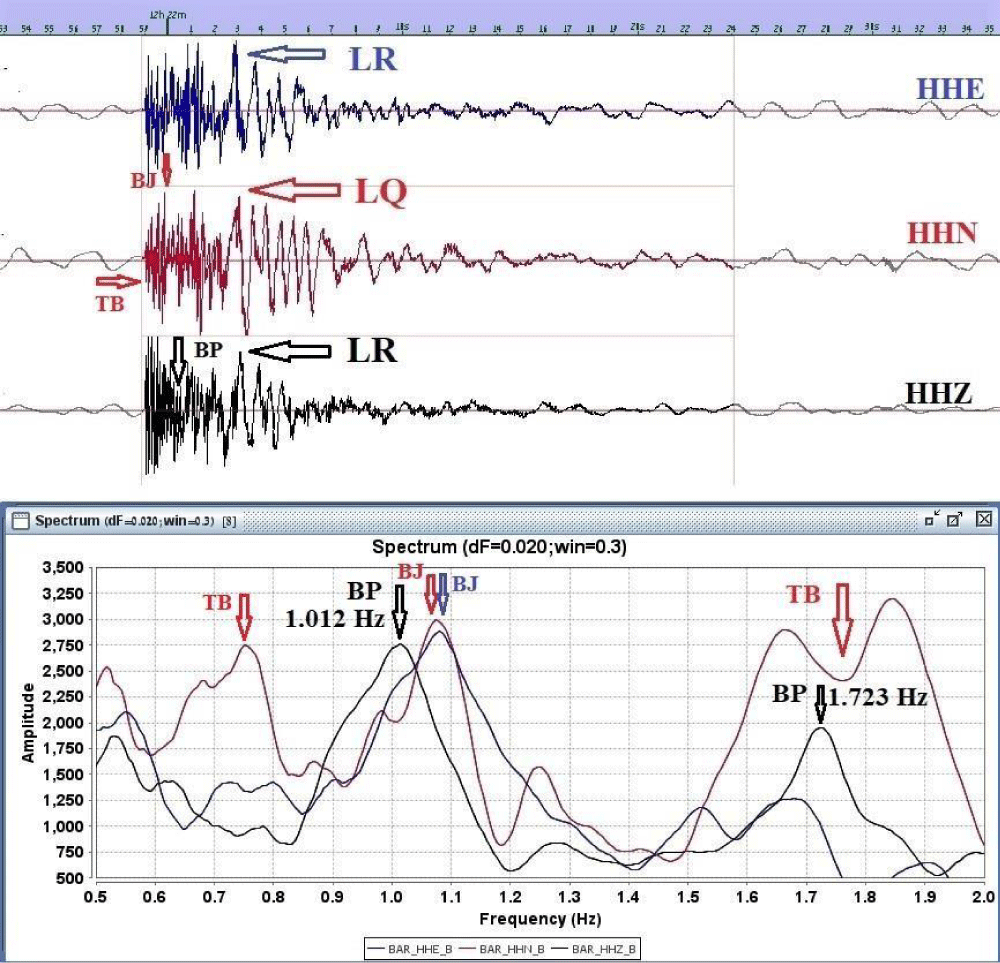
Figure 6: 3-component seismograms and high-resolution spectra for the ROKS Cheonan Sinking underwater explosion at BAR station. The characteristic motions of an underwater explosion (BP, BJ, and TB) are clearly shown on the 3-component (N-S, E-W, and Z) spectra. It is very remarkable to observe a toroidal bubble (TB) deformation which is followed by a bubble jet (BJ) immediately before a bubble pulse (BP) in the time domain as well as in the frequency domain. It is also possible to observe a series of clear modulations of bubble pulse at 1.012 Hz (first bubble pulse) and at 1.723 Hz (second bubble pulse) in the spectra.
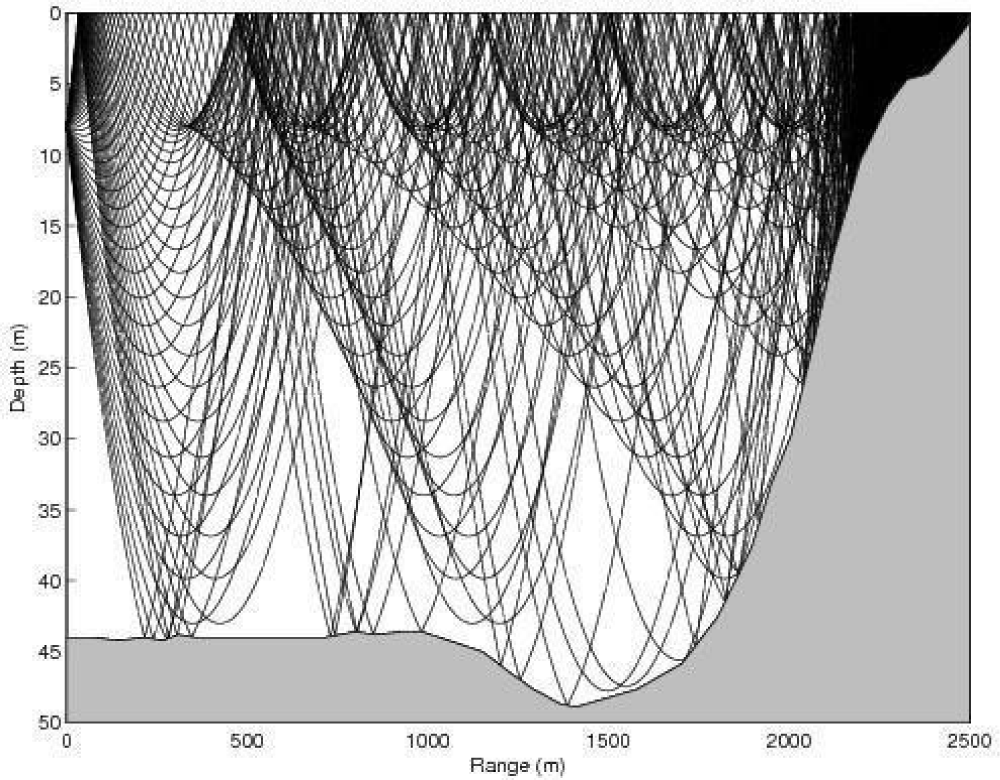
Figure 7: Ray-tracing based on hydroacoustic wave speed in the early spring season with a UWE source detonated at about 8 m offshore the Baengnyeong Island in the Yellow Sea. It exhibits shallow guided waves produced by total reflection of hydroacoustic waves from the free surface in the low-velocity layer at the subsurface and deep guided waves which are trapped by total reflection of hydroacoustic waves from the sea bottom [1-3].
fd = V0/4d; fnd = (2n-1) x fd, n = 1, 2, ... (4)
Where fd is a cutoff frequency and from Eq. (4) the detonation depth d is as follows:
d = 1500/(4 x 47.5) = 7.89 m ≈ 8 m (5)
Using the surface cutoff frequency, the detonation depth is estimated at 7.89 m.
It is very clear to find reverberation frequencies from the sea floor and reflected frequencies from the hull of the ship in the spectra of a 15 seconds time window in Figure 8. The spectral maxima at 8.5 Hz and ≈ 25 Hz are reverberation frequencies (the first and third harmonic), whereas the maxima of the red arrows at ≈ 17-18 Hz (first harmonic) and ≈ 34-35 Hz (second harmonic) indicate reflection spectral amplitudes which are formed by reflection from the hull bottom with small spectral nulls which are made by the superposition of destructive interference of direct P-wave arrivals and the reflected P-wave arrivals from the hull.
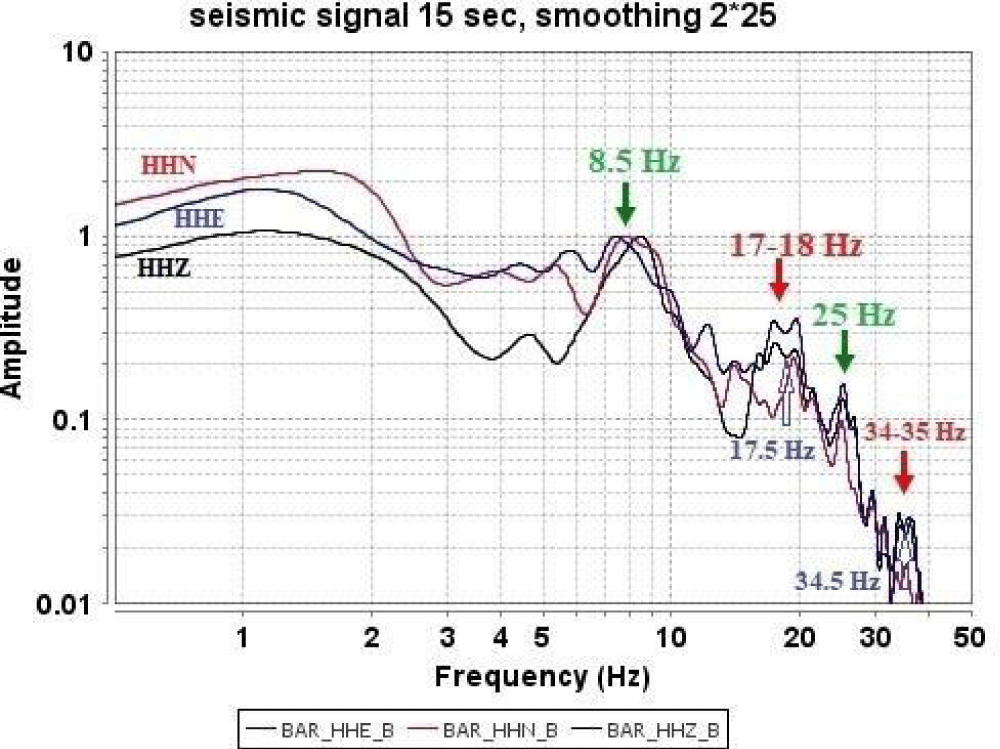
Figure 8: Smoothed normalized spectra of a seismic signal of time window 15 sec. The downward green arrows at 8.5 Hz and 25 Hz show reverberation frequencies from the seabed while the downward red arrows at 17 Hz - 18 Hz and 34-35 Hz reveal the reflected P-waves from the hull of the ship showing spectral nulls at 17.5 Hz and 34.5 Hz on the vertical and E-W (radial) components.
The reflected amplitude maxima distinctly appear on the vertical and radial (E-W) components due to the characteristics of P-wave propagation [3,5]. It is also evident that spectral nulls at 17.5 Hz and 34.5 Hz are due to the time difference between the onsets of P-wave arrivals and those of the downswing depth phases pP in the time domain, which in the frequency domain delay times for depth phase produce sharp holes as spectral nulls at 17.5 Hz and 34.5 Hz.
Hong [14] also observed the P-wave spectra at frequencies of 8.5 Hz and its multiples (17.7, 34.6 Hz) including modulation of spectral amplitudes at frequencies around 26 Hz. However, it may be confusing that 8.5 Hz, 17.7 Hz, 26 Hz and 34.6 Hz may be considered a series of modulations of reverberation. It is of significance to observe small spectral nulls (17.5 Hz and 34.5 Hz) on the vertical and E-W components. Those spectral nulls may be due to destructive interference by reflected P-wave amplitudes under the ship hull and the direct P-wave arrivals at the same station (Figure 8). The findings of spectral nulls at around 17.5 Hz and 34.5 Hz may suggest that the detonation depth can be estimated using those spectral nulls [3-5]. Taking into account the previous depth estimates, the medium velocity inside the gas bubble may turn out to be 280 m/sec which may be much less than the normal sound velocity in air, creating a gaseous void of lower pressure than the surrounding water by pushing all of the materials such as smoke (vapor), dirt, debris and explosive chemicals from the central point, but the void is instantaneously mixed with them in the cold seawater.
It should be noticeable that 8.5 Hz, 17-18 Hz, 25 Hz, and 34-35 Hz are not natural frequencies from the collision between a ship and a submarine. However, Kim and Caresta (2014) used those frequencies as natural frequencies from the collision. As a result, they must have made some reversible mistakes in their study regarding a collision of the ROKS Cheonan with a submarine. The natural frequencies of a vibration source for a submarine cannot be detected at seismic stations because the vibration source is low energy and has little impact force for viscous dynamic force in impulse (little force over a long time by force x time interval in physics). Sang-Gab Lee [15] hydrodynamically denied the collision story of the ROKS Cheonan Sinking with a submarine because of the low energy and resistance of the water.
It is possible to calculate the hydroacoustic wave propagation using the BELLHOP Gaussian beam ray-tracing program [16] from an underwater explosion in the early spring cold water of the Yellow Sea, assuming that a seismic source is detonated at a depth of about 8 m in the water depth of around 44 m in Figure 7.
Love waves strongly appear on the N-S (tangential) component in the time domain because the ship headed for 327º with 6.7 knots when it was split into two parts in the direction of the NS and Love waves are detected on the tangential component. The first bubble pulse (BP) appears on the vertical component (HHZ) showing the rarefaction motion (downward collapse) whereas bubble jets (BJ) are present on the horizontal components (N-S and E-W) due to the vortex motion[13] in the time- domain and frequency-domain, but the initial toroidal bubble deformation (a large peak TB) and last toroidal bubble deformation (a small peak TB) on the N-S component (HHN) on the high-resolution spectra due to the splitting direction of NS. The maxima amplitudes on the spectra start with the first toroidal bubble deformation (TB) [12,13] and are followed by a bubble jet (Figure 6) and (a bubble collapse pulse).
Figures 2 and 6 highlight the proofs of an underwater explosion for the ROKS Cheonan Sinking showing the characteristic motions of an underwater explosion in seismograms and spectra showing a bubble pulse on the vertical component, bubble jets on the horizontal components (N-S and E-W), and a toroidal deformation on the N-S component. It is also noticeable to find a series of clear modulations of bubble pulse at 1.012 Hz and at 1.723 Hz in Figure 6.
Figure 9 shows that the sound waves arrived at the seismic station about 31 seconds later indicating that the signals of sound waves from an underwater explosion reached the station much slower than P-wave arrivals. However, in the beginning, Korean mass communication media such as broadcast, SNS (social networking service), and websites mentioned the collision of the stern against the sea bottom 31 seconds later owing to the misinterpretation of the 31 second-signal. Nonetheless, the actual sinking times of the stern and bow for the ROKS Cheonan were found to be about 6 minutes and 16 hours, respectively [3,5].
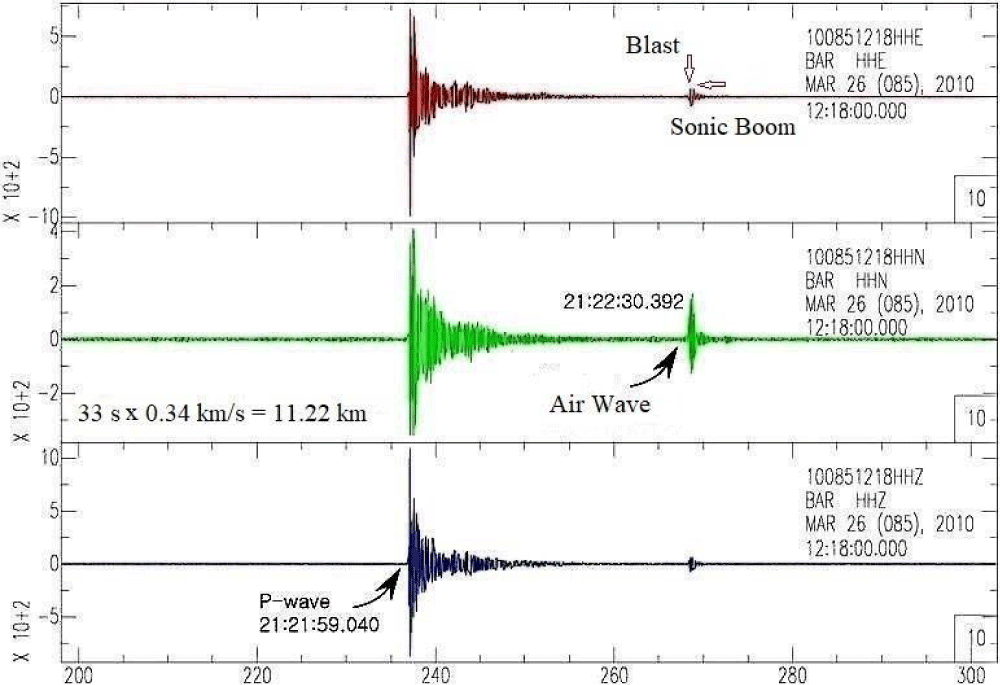
Figure 9: Airwaves (> 30 Hz) with a blast and a sonic boom are detected 31s later at Baengnyeongdo station after the ROKS Cheonan underwater explosion. The high amplitudes of airwaves on the N-S component may indicate that the ship was split into two parts in the north-south direction.
A high-frequency monotonic acoustic wave with an apparent group velocity of 340 m/s is observed in the time domain (Figure 9). The acoustic-wave amplitudes in horizontal components (N-S component) are stronger than those in the vertical component, which is consistent with the splitting the direction of the ship as shown in the toroidal bubble deformation [13] of high-resolution spectra in Figure 7. The travel time of the acoustic wave additionally constrains the event location. The observation of the highest amplitude with the compressional first motion (up, +) on the vertical component (≥10^3 nm/sec) and high P/S amplitude ratios may also suggest an underwater explosion (Figures 5 and 9).
We can show that the 1.1 s is not an interval due to supersonic N-wave effects, not to a bubble pulse. However, it is very possible to determine the definite bubble pulse of 1.012 Hz (0.988 s) in terms of the high-resolution spectra in Figure 6. The infrasound records detect the infrasound signals (< 20 Hz) and cannot detect the bubble pulse of an underwater explosion in this case.
The first peak is a burst of an underwater explosion and the second one is a sonic boom (N-wave) [3- 5] in Figure 4. The N-waves are well described by Sorrells, et al. [2002]. N-waves are made by shock waves or sonic booms which are faster than sound waves. Hewitt [18] elucidated the fundamental concept of N-wave that a shock wave is made up of two cones – a high-pressure cone with the apex at the bow of the supersonic aircraft and a low-pressure cone with the apex at the tail resulting in the shape of the letter N. Therefore, the time interval of 1.1s is the time difference between the first burst of an underwater explosion and a sonic boom of shock waves and it is not a bubble pulse period. Therefore, it may be not correct for MCMJIG [19] to apply this time interval from the infrasound signals for the Willis formula to estimate the detonation charge weight.
Two marine sentries on the ground heard two impactful sounds: the first, a relatively weak sounding ‘Kung’, and around 1 second later, a thundering and wrecking sound ‘Kwang’. The first sound is the burst of an underwater explosion whereas the second one is a sonic boom (Figure 4). Two marine sentries also saw a flash before “Kwang” at a maximum height of around 103 m or at least greater than 50 m according to the Swisdak Experiment [3,20] from 2.5 km away at around 21:22 (origin time = 21:21:57) on March 26, 2010 [19]. It is noticeable to have observed a sonic boom as well as a blast of an underwater explosion in the infrasound records (Figures 9 and 4). It should be noted that an interval of 1.1s in Figure 4 is almost the same as the bubble pulse period (0.988 s), but it is not the bubble pulse period for an underwater explosion of the ROKS Cheonan Sinking.
Damage phenomena and hydrodynamic modeling by BEM
Figure 10 shows how the bubble jet struck the hull of the ship when the ship was split into two parts. The red equilateral triangle-type damage at the portside (a, in Figure 10) may indicate that the ship must have been stricken by the strong and elaborate physical force with symmetry at a centroid. The force may be due to the bubble jet resulting in the counter-clockwise vortex immediately before the gas bubble collapses.
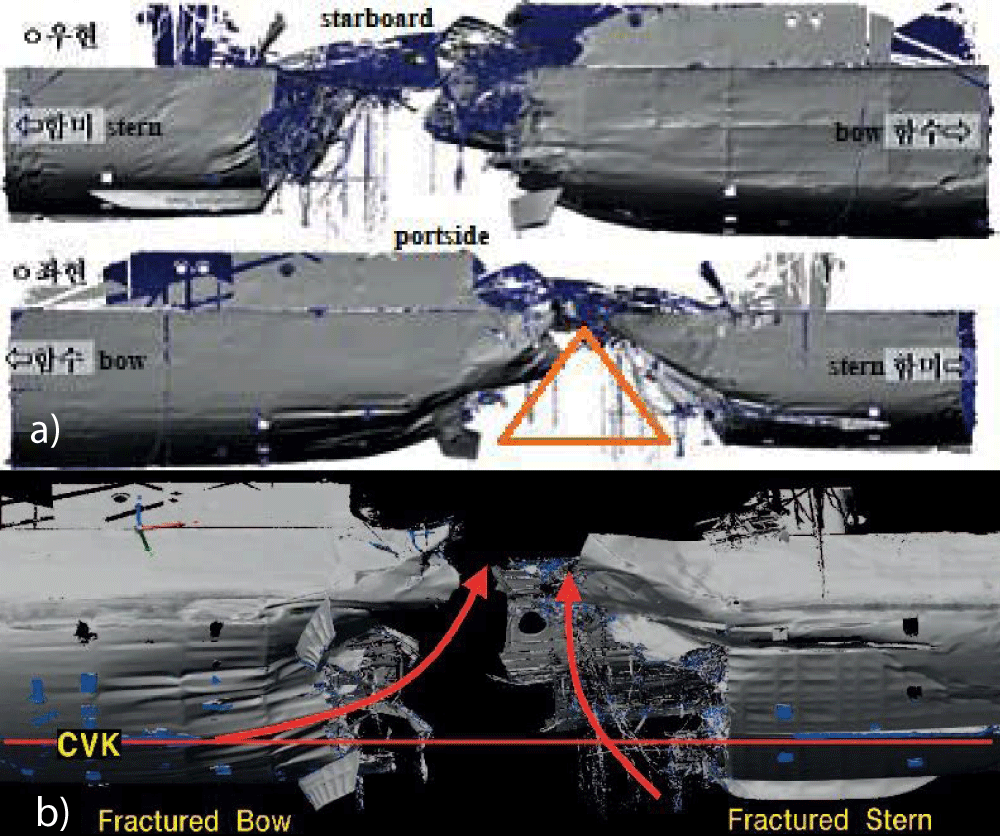
Figure 10: a) The split forms indicate that the split forms for starboard and portside fractures show an equilateral triangle-split form due to an explosion at the portside. b) The split ship is shown in a 3D laser scan image of the fractured bow and stern for the starboard side.
The equilateral triangle damage mark also reveals the material evidence that the damage and split of the ship were not due to arbitrary and asymmetrical forces such as a collision of a ship with a submarine or a running aground. The more severe damage on the stern part (b in Figure 10) may be due to the counter-clockwise vortex from the bubble jet resulting in sinking the stern part much earlier than the bow part. It took about 6 minutes for the stern to sink while it took about 16 hours for the bow to sink [3,19].
It is the start of the running aground that the last recorded time of the CCTV image was recorded at 21:17:03, indicating that electricity was lost by cutting off inside the ship [3]. Fishing nets were found entangled around the right screw axle of the damaged ship in Figure 11.
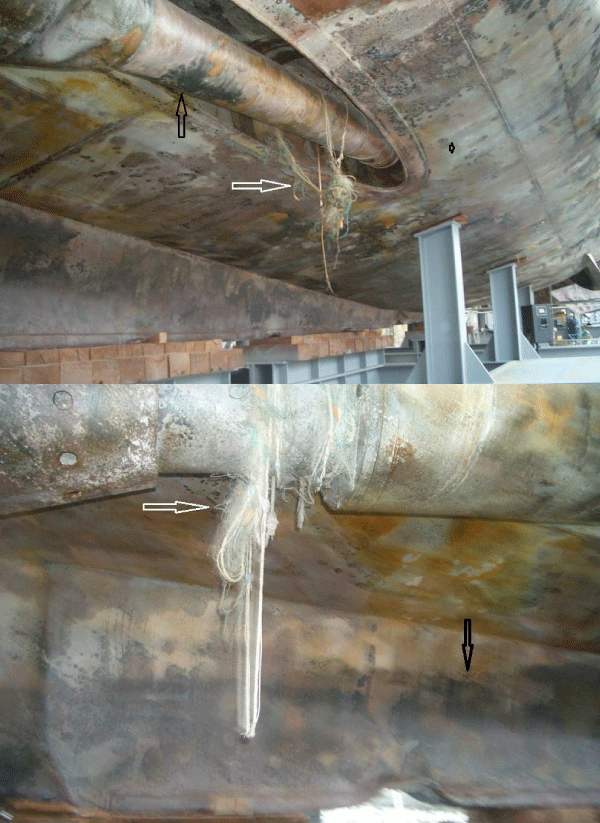
Figure 11: The tangled fishing net wires (white arrows) on the propeller axis indicate the running aground before the explosion, and the black charred hull surface (soot) may be due to the flame at the moment of the blast for an underwater explosion (black arrows). Also, it cannot be ruled out that the strong ICCP current might flow on the hull surface when it ran aground before the underwater explosion [2-3,5].
This contradicts the MCMJIG [19] claim that there were no fishing zones in the area of the ship’s voyage. The running aground site was also reported at a depth of 6.4 m and about 4 m in case of a low ebb which caused a running aground of the ROKS Cheonan because of a draft of 2.87 m for the ship [3]. The tangled fishing net wires (white arrows) on the propeller axis indicate that there must have been running aground before the explosion. Before the sinking, the bottom of the Cheonan ship touched the shallow ocean floor. The fore side deformation of the starboard propeller (screw) and off-set shaft axis is due to a collision with the seabed, The aft view of the starboard propeller blades bent opposite of its rotation (clockwise) may be formed during the collision with the seabed [2]. The entangled fishing net wires are found around the right screw axle of the damaged ship. The black charred hull surface (smoke soot) in Figure 11 may be due to the flame at the moment of a blast for an underwater explosion (black arrows). However, the strong ICCP (Impressed Current Cathodic Protection) current might flow on the hull surface and cannot be ruled out during running aground before the underwater explosion [2-5].
Through the bubble pulse period of 0.988 s obtained via spectral analysis, the approximate net explosive weight and explosion depth are estimated by narrowing down the possible parameters along with supplementary estimations of the bubble pulse periods of 0.967 s via Rayleigh–Willis equation, 0.976 s via BEM and 1.030 s via 3D bubble shape simulation derived for the case of a 136- kg TNT net explosive weight detonation (Figures 10 and 12). The more detailed studies about hydrodynamics are well presented in the previous work [2,3].
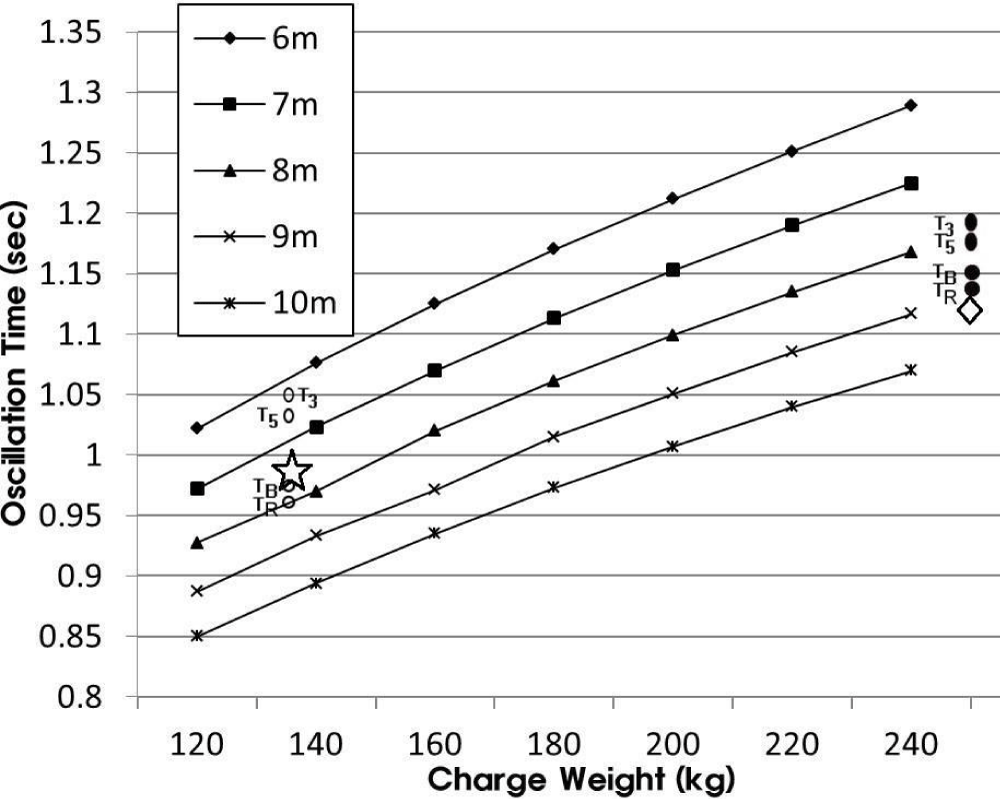
Figure 12: The relationships of the charge weights versus bubble pulse periods in the free surface. Distribution of possible bubble pulse periods by analytical solution [21] with Rayleigh-Willis equation (TR), BEM (TB), 3D simulation (T3, T5) for 136 kg net explosive weight (open ellipse) at a depth of 8 m at 3 m and 5 m port side of the hull centerline and for 250 kg net explosive weight (closed ellipse) at a depth of 9 m at 3 m and 5 m port side of the hull centerline [3,4].
0.5 s = BP Max, 0.791 s = TB, 1.007 s = BJ, 1.030 s = BP (0.988 s from Figure 7).
Relative errors are estimated from the observed bubble pulse period vis-à-vis 3D simulation with detonation occurring at 3 m and 5 m portside (PS) of the hull from the centerline as follows [2-4]:
4.04% 136 kg TNT at 8 m (depth), PS (portside) 5 m; 6.87% 136 kg TNT at 8 m, PS 3 m, 18.38% 250 kgTNT at 9 m, PS 5 m; 20.10% 250 kgTNT at 9 m, PS 3 m.
By the Bjerknes Effect [3,9-11], the rigid boundary can attract the explosion bubble while the free surface repels it. Since the buoyancy force and Bjerknes attraction of the rigid hull are comparable, the bubble pulse from the experiment may be longer than that of the ROKS Cheonan Sinking underwater explosion (Figures 6 and 13). If the oscillation gas bubble is close enough to a rigid body then the pressure differential created as the bubble decreases in volume will result in the bubble collapsing onto the hull and producing high speed (130-170 m/s range) [2,3] water jet (bubble jet) which may be capable of holding the hull of the ship (Figure 10). The bubble shape immediately before and immediately after jet impact has been investigated by various researchers [2,3,12,13]. As a result. The analyses show that, by parametric study, a 16 kg charge yields a bubble pulse consistent with the observed seismic data.
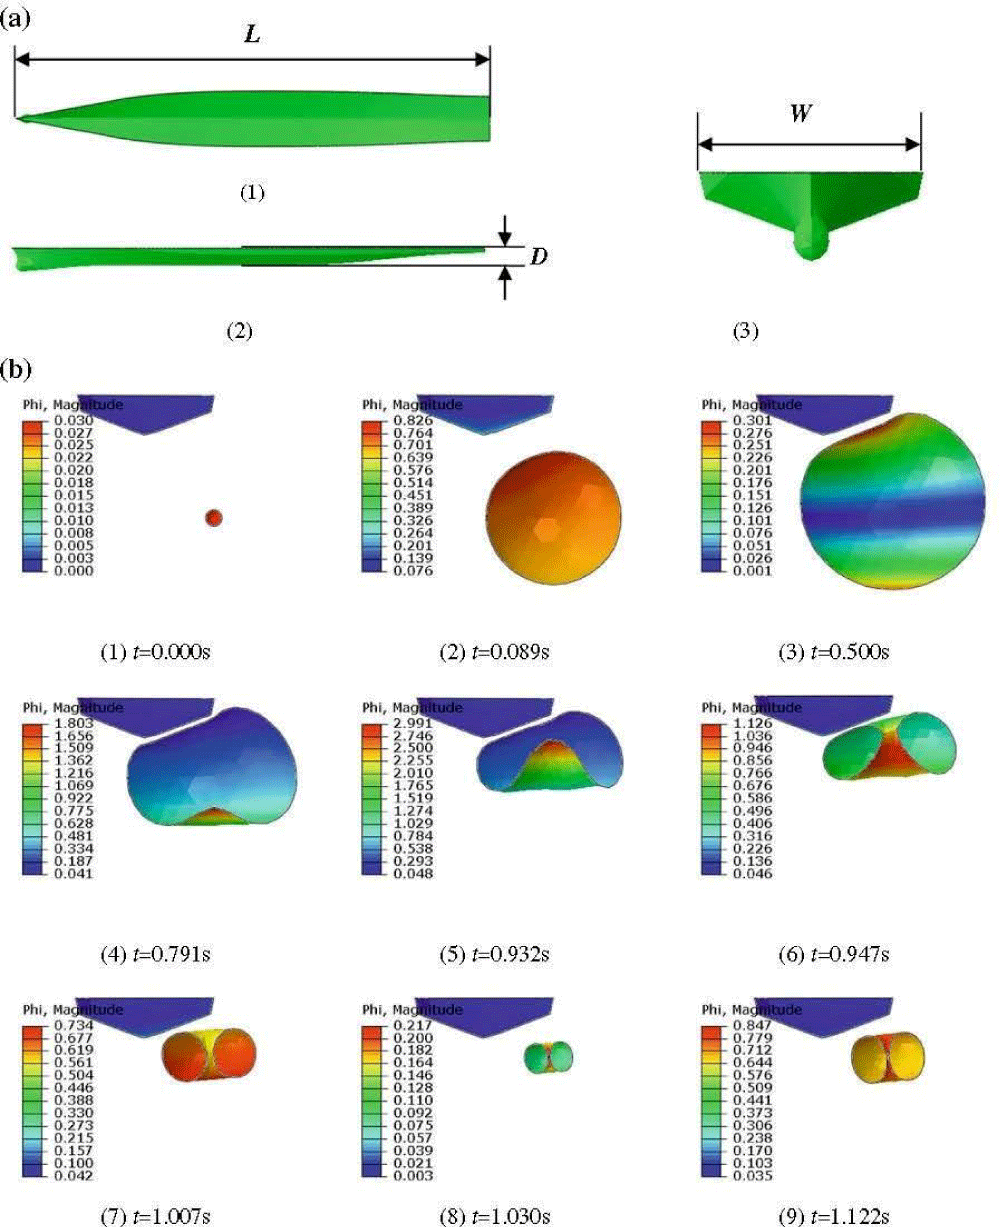
Figure 13: The behavior of 3D bubble shape simulation takes into account the interaction between the bubble and the ship’s hull based on the boundary element method (BEM). The color contour represents the magnitude of the velocity potential [13]. a. (1) bottom view (L = 88 m) (2) side view (D = 2.9 m) (3) front view (W = 10 m). b. Bubble shape formation near ship’s hull: t = 0.000, 0.089, 0.500, 0.791, 0.932, 0.947, 1.007, 1.030, 1.122 s with 136-kg net explosive weight detonation at a depth of 8 and 5 m port side of the hull centerline. After a bubble pulse starts contracting, a toroidal bubble formation [9,10,12,13] at TB (0.791 s), just before a bubble pulse (BP) at 1.030 s and a bubble jet (BJ) occurs at around t = 1.007 s and the bubble gets a minimum at 1.030 s (BP) [2-4].
Magnitude - charge weight relationships
The open star and diamond represent a charge weight versus a bubble pulse period for the ROKS Cheonan Sinking in this study and that for MCMJIG [19]. It is noticeable that the star is not along the line at a depth of around 8 m since the ROKS Cheonan sinking underwater explosion took place beneath the ship, not the free surface.
The oscillation time of the gas bubble is calculated from the modified Rayleigh -Willis formula:
Tb = kW1/3/(P0 + ρgd)5/6, (6)
where k is the constant, W is the product of volume and pressure of air gun in work energy for marine seismology, P0 is the atmospheric pressure at the sea surface (1.01325 x 10⁵ Pa), ρ is the density of seawater (1,025.52 kg/m3) at 3 °C and 3.2% salinity, g is the gravity constant (9.81 m/s2), and d is the detonation depth (m). A more commonly used simplified approximation model using the SI units is derived as follows:
Tb = KT W1/3/(10.1 + d)5/6 (7)
Where KT slightly varies (2.10–2.11), depending on the experimental and approximation methods utilized. The analytical dependence of bubble pulse frequency on explosive yield and detonation depth was investigated by many researchers [2,3,13,22]. Utilizing this simplified approximation model of Eq. (7), the fundamental frequency fb and the spectral harmonic series are represented as follows:
fb = 1/Tb; fnb = nfb, n = 1, 2…
Taking into account the only first bubble pulse period Tb, the simplified Rayleigh - Willis formula [1,3,6,21,23,24] in the free surface water is given as follows:
Tb = 2.1W1/3/(10 + d)5/6 (8)
Eq. (8) generally applies only to free-water explosions. Swisdak [20] suggested that Eq. (8) should be applied to depths and charge weights such that the bubble is not closer than about 10 bubble radii to either the surface or the bottom [20]. The relationship between a minimum depth of the detonation and a bubble is also demonstrated by several researchers [2,3,20,25], Using Eq. (8), 0.988 = 2.1 x 136 1/3/(10 + d)5/6, the detonation depth is estimated at 7.74 m, which represents an open star in Figure 12 that is not consistent with the graph since it is based on the free surface.
Case study underwater explosions
Some uncertainties for the relationship between magnitude and charge weight are analyzed for some free surface underwater explosions such as the Russian underwater nuclear explosion and US Navy shock trial explosions, including more complicated underwater explosions such as the Kursk and the ARA San Juan submarine events which include much more complex explosions such as implosions. In particular, it was difficult to determine a bubble pulse from the ARA San Juan submarine explosion since the small seismic source was inside the submarine and the hydroacoustic waves also travel through the anisotropic path to the hydrophone stations. More detailed analyses are described by various researchers [3,26-29].
The Russian (USSR) underwater nuclear explosion
The underwater nuclear explosion was conducted at the Bay Chernaya of Novaya Zemlya Island (probably of the Barents Sea) at a depth of about 101 m with 1.56 kt TNT on October 23, 1961 (Kim, 2001a). P,S, LR, BP, BRF and SRF indicate P- and S- wave arrivals, Rayleigh wave, bubble pulses, and reverberation frequency from the seafloor and a reflected phase from the surface at 3.61 s after P-wave onset which was recorded on the broadband (0.2-30 s) at town Belushya 120 km away from the epicenter (Figures 14).
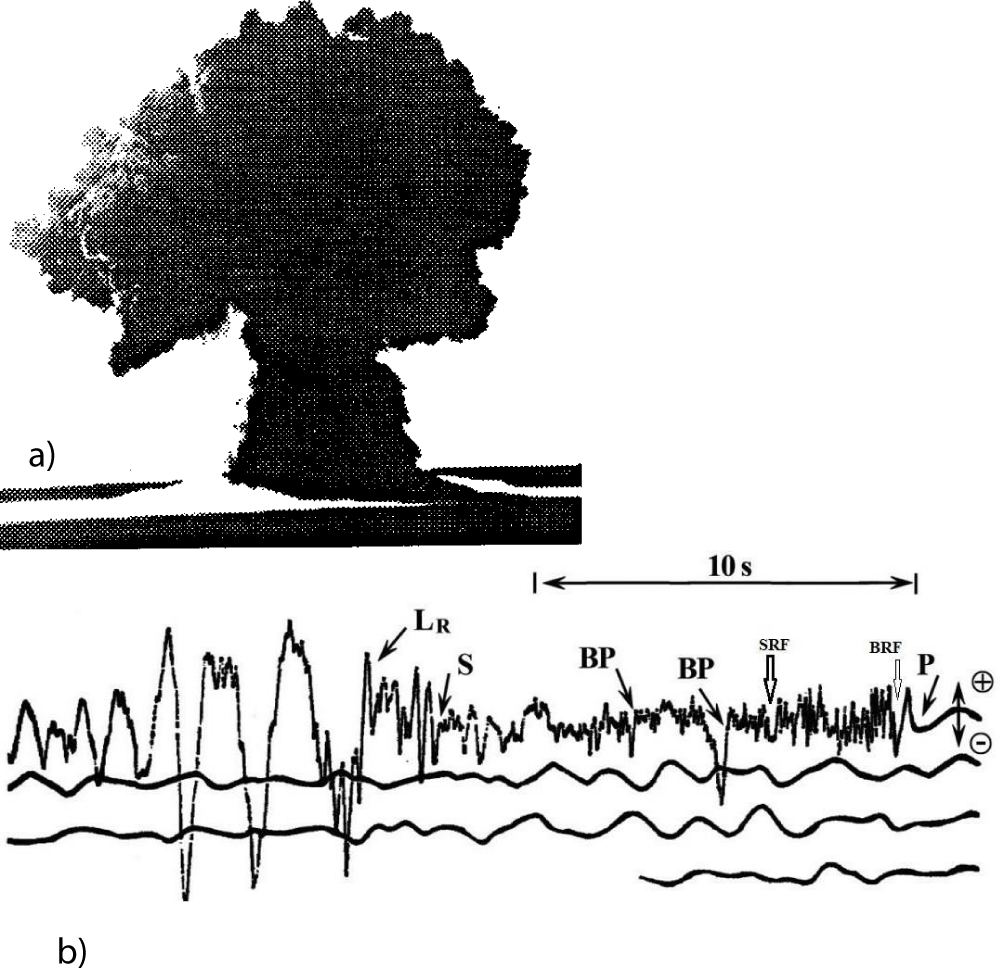
Figure 14: a) The Russian underwater explosion on October 3, 1961, showed a theoretical maximum height of about 2.2 km or at least greater than 1000 m according to the Swiadak experiment [20]. b) The vertical component seismogram represents the third Russian (USSR) underwater nuclear explosion which was conducted near Novaya Zemlya Island at 08:31:22.1 (GMT) on October 23, 1961 [30]. It was recorded in the town of Belushya 120 km away from the epicenter [30,31]. The bubble pulses (BP) with rarefaction (downward) distinctly appear on the seismogram.
Various researchers [30,31] estimated 10-20 kt at a depth of 20-50 m whereas Johnston [32] presented 4.8 kt at a depth of 20 m in his catalog. However, this study estimates the yield at 1.56 kt using magnitude 5.10 [32] at a depth of 101 m and a bubble radius of 92 m in the ocean depth of about 194 m of the Barents Sea [3,5], including about 2.2 km or at least greater than 1000 m of the water plume [3,20]. Distance, explosive charge weight, and detonation depth are estimated using Eqs. (9), (10), and (11).
The calculated distance is estimated at 107.5 km: S-P = 12.77 s,
D (distance) = 12.77s x [VpVs/(Vp-Vs)]=107.5 km, (9)
Where Vp = 6.32 km/s and Vs =3.61 km/s.
From 5.10 = 0.753log(W)+0.436,
W = 1.56 x 10⁶kg TNT=1.56 kt TNT (10)
From 4.82 = 2.1(1,560,000)1/3/(d + 10)5/6
d (detonation depth) = 101 m (11)
Even if S waves are weak, the high amplitude of Rayleigh waves is due to the conversion of P-waves through the seafloor and the upper crust. The seismogram well exhibits bubble pulse phases (BP) of rarefaction (negative phase arrivals) in the time domain. A principal feature of an underwater explosion is a distinct rarefaction impulse (negative) arrival (BP) with an amplitude 2 times larger than that of the first P-wave arrival. The first bubble pulse period is 4.82 sec (0.207 Hz) and the second one is about 2.53 sec (0.395 Hz). As a result, the detonation depth is estimated at 101 m from equations (7) and (8). Using the seafloor reverberation frequency (1.93 Hz) in the record, the sea depth is estimated at 194 m, which therefore may be assumed to belong to the continental shelf of the Barents Sea where the submarine can submerge freely and launch a nuclear warhead from the submarine in the Barents Sea.
US navy shock underwater explosions
The averaged magnitude from the REB magnitudes determined by IDC/CTBTO is more appropriate than the USGS PDE (Preliminary Determination of Epicenter) reported magnitude to apply the relationship of magnitude versus charge weight for US Navy shock trial underwater explosions (Table 1). Heyburn, et al. [33], Attempted to use the Dead Sea formula of Eq. (12) which has a high salinity (33.7%) compared to the normal seawater (0.35%) of Eq. (13) to use magnitude-charge relationships, resulting in a larger magnitude due to the higher acoustic impedance, and low attenuation of seismic waves. The USGS magnitude 3.7 is a preliminary reported Richter magnitude (PDE) right after the US Navy trial underwater explosion. However, the REB was reported later in Table 1 [33] shows less than the PDE magnitude of USGS. The USGS PDE magnitudes may be also overestimated using the conventional method of magnitude estimate for continental-path events. It should be noted that mb (REB) is typically about 0.4 magnitude units smaller than mb(PDE) of USGS [34]. Therefore, it may be correct and more appropriate to use Eq. (12) than Eq. (13) to find the relationship between an explosive charge weight versus the magnitude of a US Navy Shock underwater explosion. Magnitude-charge weight relationships for the Dead Sea with high salinity and high impedance of the seawater were studied by Israeli scientists [26,27] as follows:
Table 1: Ground-Truth (GT) Parameters and Parameters Published in the Reviewed Event Bulletin (REB) for Explosion Shock Trails Conducted East of Florida in 2001, 2008, and 2016 [33]. The Reviewed Event Bulletin (REB) is produced by CTBTO’s IDC. |
|||||||
| Ground-truth Estimate (GT) | Revised Event Bulletin (REB) |
|
|||||
| Date | OT | Lat (N) | Lon (W) | OT | Lat (N) | Lon (W) | mb |
| 2001/05/24 | 17:16 | 30.307 | 79.91 | N/A | N/A | N/A | N/A |
| 2001/06/03 | 14:58 | 30.243 | 79.851 | 14:58:12.25 | 29.890 | 79.480 | 3.3 |
| 2001/06/03 | 18:28 | 30.165 | 79.908 | 18:27:54.43 | 30.199 | 79.681 | 3.4 |
| 2008/08/16 | 19:15 | 29.887 | 79.725 | N/A | N/A | N/A | N/A |
| 2008/08/26 | 21:01 | 29.824 | 79.583 | N/A | N/A | N/A | N/A |
| 2008/09/13 | 17:05 | 29.811 | 79.569 | N/A | N/A | N/A | N/A |
| 2016/06/10 | 17:12 | 29.941 | 79.575 | 17:10:48.97 | 30.084 | 79.633 | 3.6 |
| 2016/06/23 | 17:20 | 29.948 | 79.479 | N/A | N/A | N/A | N/A |
| 2016/07/16 | 20:01 | 29.676 | 79.573 | 20:00:12.28 | 29.442 | 79.687 | 3.2 |
| 2016/09/04 | N/A | N/A | N/A | 18:29:31.68 | 30.362 | 79.537 | 3.2 |
| 2016/09/21 | N/A | N/A | N/A | 16:30:54.83 | 30.173 | 79.568 | 3.2 |
| Mean | 3.32 ± 0.15 | ||||||
ML = 0.285 + log (W) (12)
For normal seawater by [1,3] as follows;
ML = 0.753 log (W) + 0.436 (13)
Where ML is a modified local magnitude equivalent to mb. The recorded local magnitude for the Dead Sea explosions in Eq. (12) agreed well with values predicted by an empirical magnitude charge weight relation derived using a series of small-scale Dead Sea explosions detonated in the Dead Sea [24,26]. However, the higher salinity and hence its acoustic impedance is significantly higher than normal sea waters in regions such as the coastal waters of Florida, which leads to a larger magnitude estimate as to the energy flux density scales with the reciprocal of the acoustic impedance (see a diamond in Figure 15).
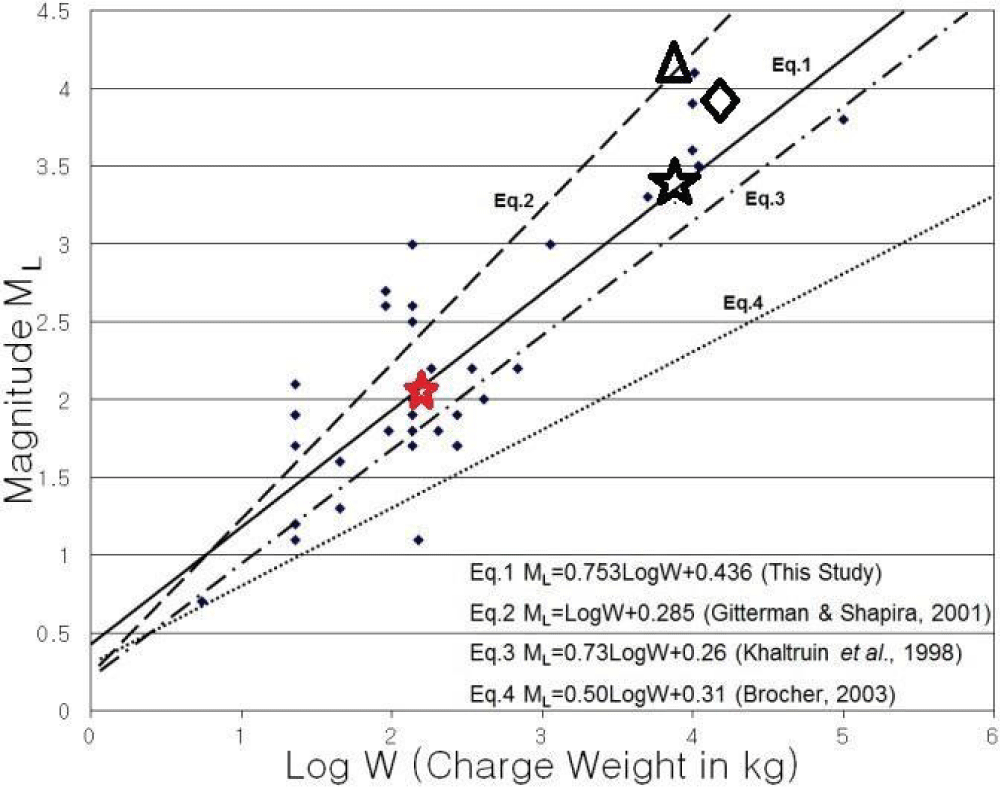
Figure 15: The reported magnitude for underwater and land detonations versus charge size. Empirical relations between local magnitude and underwater explosions from this study (Eq. 1) (solid line) [1], for Dead Sea underwater explosions with high salinity (Eq. 2) (dashed line) [35], the empirical upper limit magnitude of chemical land explosions in hard rock, for nuclear explosions (Eq. 3) (dotted and dashed line) [27] and coda magnitude of land explosions in California and Nevada, including most of coda duration magnitudes (Eq. 4) (dotted line) [36].
Heyburn, et al. [33] applied the formula obtained from the Dead Sea with high salinity and the NEIC PDE magnitude of 3.8 may result in different relationships between the magnitude and charge weight for the underwater explosions of the US Navy shock trials in Table 1 and Figure 15. The explosive charge weight and the detonation depth for the US Navy shock trial are previously known as about 6759 kg TNT and 61 m [33]. Open star, diamond, and triangle symbols indicate relationships between magnitude and explosive charge weight for US Navy shock trials from Eq. 13 (Eq.1 in Figure 15) and ML = 3.32 using W = 6759 kg TNT for given data [33], from Eq. 12 (Eq. 2 in Figure 15) and a peak pressure formula and ML = 3.8 using W = 7045 kg TNT (Heyburn, et al., 2018), and Eq. 12 (Eq.2 in Figure 15) and ML = 4.11 using 6759 kg TNT, respectively. The open diamond [33] is separated from the normal seawater group in Figure 15 implying that it may not fit the normal seawater in the case of ML = 3.8 and charge a weight of 7045 kg TNT. The red star represents the underwater explosion of the ROKS Cheonan Sinking [1,3]. As a result, the red star of the ROKS Cheonan Sinking and the open star of the US Navy trial underwater explosions are in good agreement with Eq. 13 (Eq.1 in Figure 15) for underwater explosions in normal seawater. Therefore, the 6759 kg TNT explosive charges of the US Navy trial shock correspond to ML = 3.32 (the average magnitude of REB) in Table 1.
Magnitudes of underwater explosions in the Dead Sea are always larger than those in normal seawater, so Gitterman’s formula is perfectly correct in the Dead Sea and it must be modified to use in normal seawater. Therefore, using the known explosive charge weight of W = 6759 kg TNT by Heyburn, et al. [33] and the formula [1], ML = 0.753 log (W) + 0.436, ML = 3.32, which is equivalent to the average magnitude of the US Navy shock trials (Table 1) whereas using Equation 2, and W = 6759 kg TNT, ML = 0.285 + log (W) = 4.11 in Figure 15. It may suggest that the NEIC published magnitude (PDE) of 3.8 may not be correct for the Florida shock trial explosion, indicating that the average magnitude of 3.32 of REB (Table 1) may be more reliable in this study.
The detonation yield in terms of TNT can be calculated by estimating the bubble pulse period and detonation depth from the empirical studies [20] as shown in Figure 16. The blue thick and red lines represent the detonation of 136 kg at a depth of around 8 m [1,3] with a bubble pulse period of 0.988 s and the detonation of 250 kg TNT at a depth of about 10 m with a bubble pulse period of 1.1 s (MCMIG, 2010). The thick black line indicates the detonation of 100 kg TNT at a depth of 500 m with a bubble pulse period of 0.054s and a maximum bubble radius of 2.033 m [20]. The thin green and brown lines indicate underwater explosions of US Navy shock trials at a depth of 60 m with 6759 kg TNT (ML = 3.32), and at 75 m with 4020 kg TNT for the Kursk submarine using a magnitude (ML = 3.15) by the University of Helsinki and the University of Bergen in the normal seawater formula [3]. The thin gray line indicates the Kursk submarine explosion at 61 m with ≈ 1500 kg TNT (ML = 3.5) using the Dead Sea formula [24] which may be underestimated owing to using the high salinity formula of the Dead Sea, The actual charge weight is found to be 4500 kg TNT (750 kg TNT x 6 torpedoes = 4500 kg TNT) for the main shock of the Kursk underwater explosion [3].
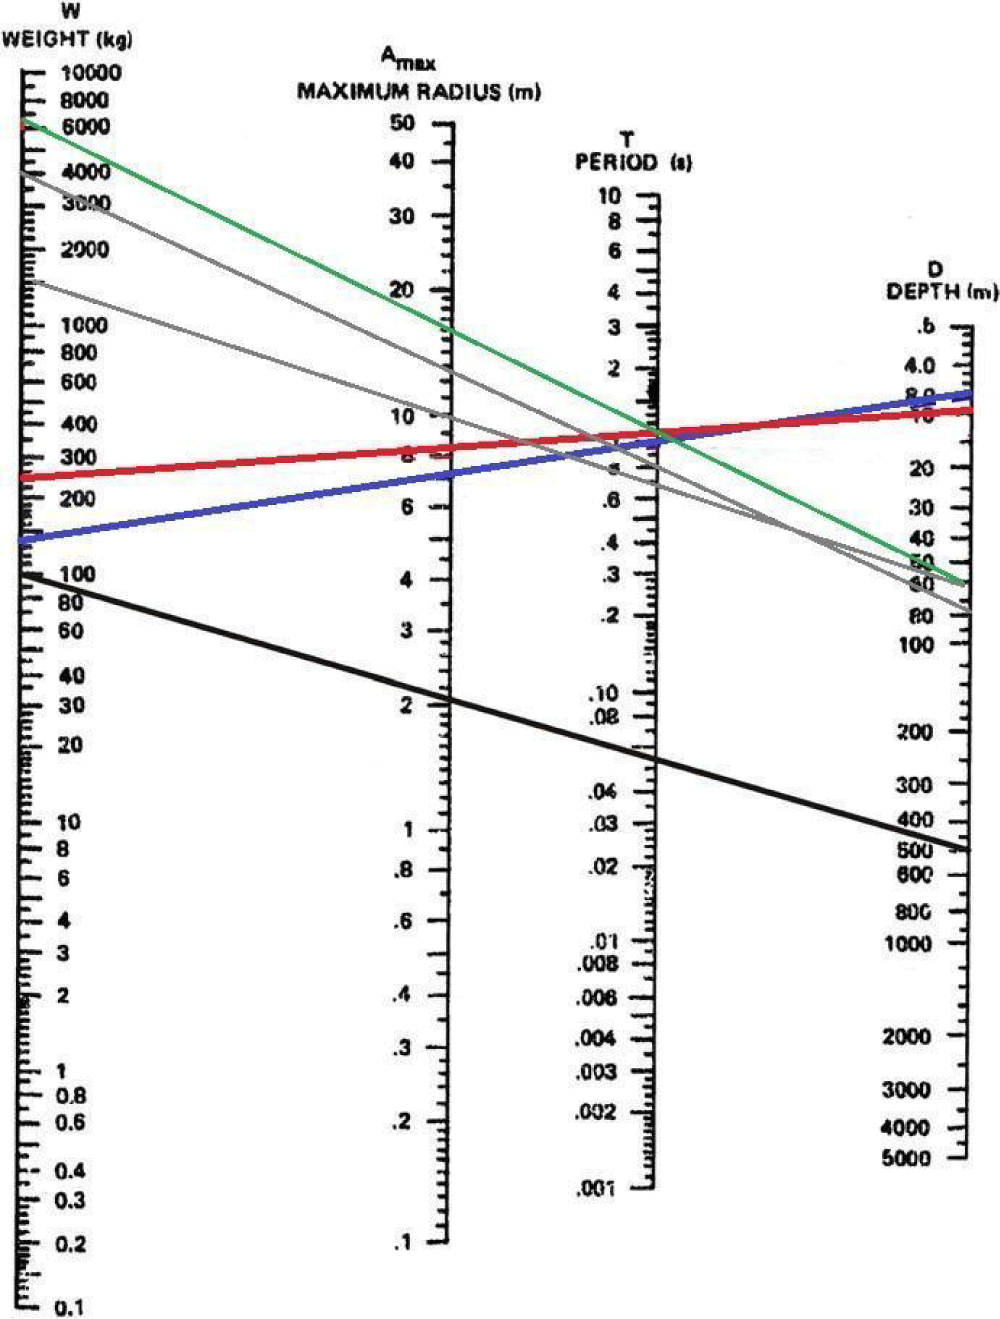
Figure 16: The nomograph of the first bubble pulse period, maximum bubble radius, and detonation depth for a gas bubble from underwater is modified adding more underwater explosion [20]. It is explosion examples. The thick blue, red, and black lines represent the detonation of 136 kg at a depth of around 8 m with a bubble pulse period of 0.988 s [1,3,4] and the detonation of 250 kg TNT at a depth of about 10 m with a bubble pulse period at 1.1 s [19] for the ROKS Cheonan Sinking and the detonation of 100 kg TNT at a depth of 500 m with a bubble pulse period of 0.05s and the maximum bubble radius of 2.033 m [20] The thin green, brown, and gray lines indicate the detonation of 6759 kg TNT at a depth of 61 m (ML = 3.32) for the US Navy trial shock, 4020 kg TNT at a depth of 75 m [3] and 1500 kg TNT at a depth of 61 m for the Kursk submarine underwater explosion [3,24,37].
It is worthwhile to use forensic seismology to identify an underwater explosion with time and frequency analyses such as detonation charge weight, detonation depth, and water depth, resulting in a smoking gun. The best-analyzing technologies for underwater explosions are to use spectral and cepstral analyses. There are two basic characteristics of underwater explosions of a bubble pulse and reverberation effects which can be found through spectral analysis for the extremely shallow underwater explosion. A source size in water is not the same as inland due to a high Q factor with little attenuation, salinity, and pressure including the optimum depth in which an experiment is conducted using depth–charge relations. It was found that signal amplitudes recorded for explosions detonated away from the optimum depth could produce amplitudes that are only 40% that of an explosion at the optimum depth (the depth at which the first surface reflection and bubble pulse are in phase) [3,20]. It is always possible to estimate a bubble pulse period, but reverberation reflections from the surface and bottom depend upon the depth of detonation and ocean, including seabed and charge weight. The uncertainty associated with yield estimation for underwater explosions, however, is comparable with similar uncertainties observed for underground nuclear explosions. This method was observed to consistently underestimate depth and yield and this was speculated to be a result of bubble-shaped deformation causing an increased period of the second oscillation. In this study, the ROKS Cheonan sinking was found to be an underwater explosion that occurred at a depth of around 8 m, approximately 5 m port side of the hull centerline with 136 kg TNT net explosive weight equivalent to 2.04 of a seismic magnitude.
Some previous workers’ publications [14, 38,39] are reviewed with some corrections and amendments [3,4]. Hong [14] did not clearly describe the dominant frequency, 8.5 Hz, and its multiples because reverberation frequencies are odd-number harmonic series, not even number series. As shown in his figure, 8.5 and 25 Hz are reverberation frequencies, but 17-18 and 34-35 Hz must be the reflections from the hull bottom with spectral nulls due to the destructive interference by the superposition of the reflected P-wave arrivals from the hull and the direct P wave arrivals from the source. On the other hand, Kim and Caresta [39] misused 8.5, 25, 18, and 35 Hz as harmonic frequencies from Hong [14] who stated that P the energy was dominant at around 8.5 Hz, with multiple frequencies of 17.7 and 34.6 Hz missing 25 Hz.
8.5 Hz and 25 Hz are odd frequency series for reverberation, while 17.7 Hz and 34.6 Hz could be the fundamental and its harmonics by the reflection of P waves from the broad hull just under the ship [3,39] assumed that the recorded seismic spectra were consistent with the natural frequencies of vibrations of a large submarine collision with a ship of a length of around 113 m (probably encounter frequencies of rolling and pitching, not associated with a collision [39]. They mistook the peak amplitude frequency of 8.5 Hz, ≈ 18 Hz, ≈ 25 Hz and ≈34 Hz from Hong’s work for the collision frequencies of the resonant frequencies which cannot be detected at the seismic station because of low energy [3,15]. Consequently, it is most unlikely that the ROKS Cheonan sank in a collision with a large submarine. It was proved that the collision with a submarine was incorrect taking into account scientific aspects of seismology, hydroacoustics, and hydrodynamics (fluid mechanics) [3,15].
Lee and Suh [38] disapproved that the JIG’s identification of two of the white powders, from the sunken ship and the torpedo fragments was correct, even if, especially JIG tried to prove this identification for a Smoking Gun of the torpedo because the torpedo was the only way to justify the ROKS Cheonan sinking as the North Korean torpedo attack. The white powders are not aluminum oxide that results from an explosion but aluminum sulfate hydroxide hydrate that can be produced naturally at a low-temperature environment (lower than 100 ℃). The fabrication of the collected torpedo was suggested by not only Lee and Suh [38] but also many other researchers related to the ROKS Cheonan sinking.
Consequently, this study concludes that the ROKS Cheonan sinking was due to an underwater explosion by 136 kg TNT yield at a depth around 8 m and 5 m portside from one of the abandoned land control mines (LCM) which were deployed near NLL (Northern Limited Lines) by the South Korean Navy in the late 1970s. There is an extremely low probability(0.000001%) [40] by the torpedo attack of DPRK for the ROKS Cheonan sinking even though Eccles presented “Possibly, but very unlikely, a moored influence mine for the ROKS Cheonan sinking” without saying the smoking gun in his final report [41]. As the aforementioned results, the ROKS Cheonan sinking can be due to neither a collision with a submarine nor a running aground against a reef according to the scientific data [1-4], but be due to one of LCM’s (99.99999 %).
I am much obliged to Yefim Gitterman (Geophysical Institute of Israel) my long collaborator for the spectral analyses of the ROKS Cheonan Sinking data. I also wish to thank Aman Zhang (Harbin Engineering University, China) for hydrodynamic analysis using the boundary element method and Orlando Camargo Rodriguez (University of Algarve, Portugal) for the ray tracing of a shallow underwater explosion. Khoo Boo Cheong (National University of Singapore, Singapore) and Anne Trehu (Oregon State University, USA) provided valuable discussions and constructive criticisms about fluid mechanics and underwater explosion phenomena which would be appreciated. I would greatly appreciate CTBTO’s funding to participate in SnT2015, SnT2017, and SNT2019, CTBTO, Vienna, Austria. I acknowledge KMA (Korea Meteorological Administration) and KIGAM (Korea Institute of Geoscience and Mineral Resources) for providing waveform data for this study.
- Kim SG, Gitterman Y. Underwater Explosion (UWE) Analysis of the ROKS Cheonan Incident. Pure and Appl Geophys. 2013; 170: 547-560.
- Kim SG. Forensic seismology and boundary elementary method application vis-à-vis ROKS Cheonan underwater explosion. J Marine Sci Appl. 2013; 12: 422-433.
- Kim SG. Multiple Studies of Underwater Explosions vis-à-vis the ROKS Cheonan Sinking, Kindle Book, Amazon, USA. 2021; 509.
- Kim SG, Gitterman Y. Forensic Explosion Seismology: Technologies and Applications, Cambridge Scholars Publishing, New Castle upon Tyne, UK. 2020; 523.
- Kim SG. Forensic Seismology vis-à-vis DPRK Nuke tests and the ROKS Cheonan Sinking, Kindle Book, Amazon, USA. 2021; 466pp.
- Rayleigh L. On the pressure developed in a liquid during the collapse of a spherical cavity, Philosophical Magazine. Series. 1917; 34(200): 94-98.
- Biot MA. The Interaction of Rayleigh and Stoneley Waves in the Ocean Bottom. Bull Seism Soc Am. 1952; 42(1): 81-93.
- Ewing WM, Jardetzky WS, Press F. Elastic Waves in Layered Media, McGraw- Hill Book Company, USA 1957; 380.
- Wang QX, Yeo KS, Khoo BC, Lam KY. Strong interaction between a buoyancy bubble and a free surface, Theroret Comput Fluid Dynamics. 1996; 8: 3-88.
- Wang QX, Yeo KS, Khoo BC, Lam KY. Nonlinear interaction between gas bubble and free surface, Computers Fluids. 1996b; 25 (7): 607-628.
- Waghmare YG, Knopf FC, Rice RG. The Bjerknes effect: explaining pulsed-flow behavior in bubble columns. AIChE Journal. 2007; 53 (7): 1678-1686.
- Wang QX, Yeo KS, Khoo BC, Lam KY. Vortex ring modelling of toroidal bubbles, Theor Comput Fluid Dynamics. 2005; 19 (5): 303-317.
- Zhang AM, Yao XL, Li J. Interaction of underwater explosion bubble with complex elastic-plastic structure. Applied Ocean Research. 2008; 3: 159-171.
- Hong T. Seismic Investigation of the 26 March 2010 Sinking of the South Korean naval vessel Cheonanham. Bull Seism Soc Am. 2011; 101: 1554-1562.
- Lee SG. Personal communication with Prof. Sang-Gab Lee on April 28, 2020, Division of Naval Architecture and Ocean Systems Engineering, Maritime and Ocean University, CEO, Marine Safety Technology, Busan, Korea. 2020.
- Porter MB, Bucker HP. Gaussian beam tracing for computing acoustic fields, J Acoust Soc Am. 1987; 82: 1349-1359.
- Sorrells G, Bonner J, Herrin E. Seismic precursors to space shuttle shock fronts, Pure Appl Geophys. 2002; 159: 1153-1181.
- Hewitt PG. Conceptual Physics, 10th edition, Pearson, Addition-Wesley, Pearson International Edition. 2006; 788. USA.
- MCMJIG (Multinational Civilian-Military Joint Investigation Group) (2010) Joint Investigation Report: On the Attack against ROKS Cheonan, Ministry of National Defense, Seoul, 313.
- Swisdak MM. Explosion effects and properties: part II— explosion effects in water, NSWC/WOL TR 76-116, 22 Feb 1978.
- Cole RH. Underwater Explosions, Princeton University Press, Princeton, New Jersey. 1948; 464.
- Gong SW, Ohl SW, KLaseboer E, Khoo BC. Scaling law for bubbles induced by different external sources: theoretical and experimental study. Physical Review E. 2010;
- Willis DE. Seismic measurements of large underwater shots. Bull Seism Soc Am. 53:789- 809.
- Gitterman Y. Implication of the Dead Sea experiment results for analysis of seismic recordings of the submarine “Kursk” explosions, Seis Res Lett. 2002; 73 (1): 14-24.
- Prior MK, Brown DJ. Estimation of depth and yield of underwater explosions from first and second bubble-oscillation periods. J Ocean Engineering. 2009; 35 (1): 201-112.
- Gitterman Y, Ben-Avraham Z, Ginzburg A. Spectral analysis of underwater explosions in the Dead Sea, Geophys J Int. 1998; 134: 460-472.
- Gitterman Y, Shapira A. Dead Sea seismic calibration experiment contributes to CTBT monitoring. Seism Res Lett. 2001; 72: 159-170.
- Heyburn R, Bowers D, Green DN. Seismic and hydroacoustic observations from recent underwater events in the South Atlantic Ocean, Geophys J Int. 2020; 223: 289–300.
- Vergoz J, Canci Y, Cano Y, Gaillard P. Analysis of hydroacoustic signals associated to the loss of the Argentinian ARA San Juan Submarine. Pure Appl Geophys. 2021; 178: 2527-2556.
- Adushkin VV, Khristoforov BD. Hydroacoustic Disturbances in Nuclear Explosions, Combustion, Explosion and Shock Waves. 2004; 40: 694–698.
- Khristoforov VV. About the Control of the Underwater and above Water Nuclear Explosions by Hydroacoustic Methods, Final Report, Russian Academy of Sciences, Institute for Dynamics of Geospheres. 1996; 91.
- Johnston WR. Database of nuclear tests, USSR: part 1, 1949-1963, modified 8 November 2006.
- Heyburn R, Nippress SEJ, Bowers D. Seismic and hydroacoustic observations from underwater explosions off the east coast of Florida, Bull Seism Soc Am. 2018; 108 (6): 3612–3624.
- Kim WY, Richards P, Greenville J. Worldwide monitoring of nuclear explosions, The Proceedings of 23rd Science Research Review, Jackson Hole, Wyoming, USA, October 2-5, 2001.
- Khalturin VI, Rautian TG, Richards PG. The seismic signal strength of chemical explosions, Bull Seism Soc Am. 1998; 88: 1511-1524.
- Brocher TM. Detonation charge size versus coda magnitude relations in California and Nevada, Bull Seism Soc Am. 2003; 93: 2089-2105.
- Savage B, Helmberger DV. Kursk explosion. Bull Seism Soc Am. 2001; 91(4): 753–759.
- Lee SH, Suh JJ. South Korean government’s failure to link the Cheonan’s Sinking to North Korea: in correct inference and fabrication of scientific data, The International Journal of Science in Society, Common Ground. 2012; 4 (1): 15-24.
- Kim HS, Caresta M. What really caused the ROKS Cheonan warship sinking? Hindawi Publishing Corporation, Egypt, Advances in Acoustics and Vibration. 2014: 514346: 10 pages, http://dx.doi.org/10.1155/2014/514346.
- Ahn S. Personal communication with Dr. Sam Ahn, one of the well-known anti-submarine experts in USA on February 16, 2013, Ahntech, Inc.San Diego, USA. 2013.
- Eccles T. Loss of Roks Cheonan, US Support to the Republic of Korea, Joint Investigative Group, 12 April through 24 May 2010, Rear Admiral Tom Eccles, USN-Chief Engineer, Naval Sea Systems Command and Senior US Representative to the ROK JIG 27 May 2010.