
More Information
Submitted: January 25, 2024 | Approved: February 08, 2024 | Published: February 09, 2024
How to cite this article: Faye PM, Dione D, Ndiaye O, Moussa Hamady SY, Ndiaye N, Traore A, et al. Optimizing Milk Safety: Applying Nuclear Techniques in X-ray Fluorescence Spectroscopy for Heavy Metal Quantification in Powdered Milk Consumed in Senegal. Int J Phys Res Appl. 2024; 7: 010-015.
DOI: 10.29328/journal.ijpra.1001078
Copyright License: © 2024 Faye PM, et al. This is an open access article distributed under the Creative Commons Attribution License, which permits unrestricted use, distribution, and reproduction in any medium, provided the original work is properly cited.
Keywords: X-ray fluorescence; Powdered milk; Heavy metal concentrations; Elemental analysis and AML

Optimizing Milk Safety: Applying Nuclear Techniques in X-ray Fluorescence Spectroscopy for Heavy Metal Quantification in Powdered Milk Consumed in Senegal
Papa Macoumba Faye1,2*, Djicknack Dione1,2, Oumar Ndiaye1,2, Moussa Hamady SY1,2, Nogaye Ndiaye1,2, Alassane Traore1,2 and Ababacar Sadikhe Ndao1,2
1Institute Technologies of Nuclear Applied, Cheikh Anta Diop University of Dakar, Senegal
2Department of Physics of Faculty of Sciences and Techniques, Cheikh Anta Diop of Dakar, Senegal
*Address for Correspondence: Papa Macoumba Faye, Institute Technologies of Nuclear Applied, Cheikh Anta Diop University of Dakar, Senegal, Email: [email protected]; [email protected]
This study conducted an elemental analysis and assessed heavy metal concentrations in five powdered milk samples (V1, L1, H1, G1, and D1) from Senegal, utilizing X-ray Fluorescence (XRF). The analysis focused on aluminum (Al), calcium (Ca), potassium (K), phosphorus (P), and chlorine (Cl). Aluminum was either undetected or found at negligible levels in all samples. Calcium levels consistently surpassed the Acceptable Maximum Level (AML) in all samples, with H1 exceeding the AML by approximately 11.1 times (27,745.06 ± 310.16 ppm). Potassium concentrations varied, with G1 exhibiting the highest levels, significantly exceeding the AML (51,058.15 ± 456.13 ppm), while V1 remained within acceptable limits. Chlorine concentrations generally complied with the AML, except for G1, which slightly exceeded the limit (3631.04 ± 31.23 ppm). Phosphorus concentrations in H1 were notably higher than the AML (13,750.94 ± 275.35 ppm). The non-uniformity in heavy metal concentrations among samples emphasizes the need for ongoing research and regulatory scrutiny to address potential risks and ensure the safety of powdered milk.
Powdered milk, as a fundamental component in human nutrition with a rich history, has evolved into a cornerstone of the global food industry. Beyond its role as a convenient and long-lasting means of preserving milk, it plays a pivotal role in a diverse range of food formulations [1]. With consumers increasingly turning to powdered milk for its nutritional benefits, ensuring its safety becomes a paramount concern [2]. This underscores the need for a comprehensive analysis of potentially toxic contaminants in powdered milk to safeguard public health [3,4].
Concerns regarding the potential presence of contaminants, such as heavy metals, pesticides, mycotoxins, and microbiological agents, raise issues regarding the safety and quality of this widely consumed product. Despite the implementation of stringent regulatory measures globally to monitor and control food product quality, ongoing scrutiny, and research are essential to address emerging challenges and potential risks [5-7].
The accurate determination of trace elements in milk is crucial for assessing its nutritional quality and ensuring consumer safety. Various analytical techniques have been employed to unravel the elemental composition of milk samples, each method presenting its own strengths and limitations [8]. The elemental composition of milk is vital for understanding its nutritional profile and identifying potential contaminants. Essential elements, such as calcium, magnesium, phosphorus, and trace elements including copper, zinc, and selenium, play pivotal roles in human health. Conversely, the presence of toxic elements such as lead, cadmium, and arsenic can pose significant health risks [9].
Several techniques are utilized for trace element analysis in milk, including Inductively Coupled Plasma Mass Spectrometry (ICP-MS), Atomic Absorption Spectrometry (AAS), and inductively coupled plasma optical emission spectrometry (ICP-OES). While each technique offers unique advantages, they often come with challenges such as sample preparation intricacies, prolonged analysis times, or the requirement of specialized instruments [10-13].
Among these techniques, X-ray Fluorescence (XRF) stands out as a prominent and versatile method for its ability to provide rapid, non-destructive, and simultaneous quantification of multiple elements. XRF, as a non-destructive technique, involves exposing the milk sample to high-energy X-rays, causing the emission of characteristic X-rays that are then detected and quantified. A significant advantage of X-ray Fluorescence (XRF) over Inductively Coupled Plasma Mass Spectrometry (ICP-MS) in milk powder detection lies in its non-destructive nature. Unlike ICP-MS, XRF allows for the analysis of samples without altering their composition. This non-destructive characteristic is particularly crucial when dealing with delicate matrices such as milk powder, where preserving the original sample integrity is paramount. By avoiding sample alteration, XRF ensures a more accurate representation of the true metal concentrations in the milk powder. This method is particularly advantageous in providing rapid results with minimal sample preparation, making it suitable for large-scale analyses in the dairy industry [14-16].
The primary aim of this study is to perform a comprehensive heavy metal analysis on five distinct powdered milk samples (designated as V1, L1, D1, G1, and H1), acquired from various markets in Senegal. This analysis will be conducted utilizing an energy-dispersive X-ray fluorescence system to assess and quantify the presence of heavy metals in each sample, contributing valuable insights into the safety and quality of these commercially available powdered milk products.
Samples preparation
Milk samples, collected from markets in Senegal, undergo analysis in the X-ray fluorescence analyzer. The analysis involves direct exposure to a silver Ag anode for excitation, and a specially optimized large-geometry detector with multiple filters serves as secondary sources in the process.
Samples analysis
The study utilized the X-ray fluorescence (XRF) method to analyze certain samples. The X-ray fluorescence (XRF) analysis was conducted using a Niton XLT900s ED-XRF spectrometer with a resolution of 178 eV at Mn Kα. The system features a window thickness of 12.7 μm Be, operates with a 50 kV, 40 A excitation tube, and a maximum power of 2 W, generating a 7 mm beam diameter. Various filters, including an excitation source with Ag, a sandwich of Al, Ti, and Mo, a Cu filter, and no filter, were employed to target specific elements in the samples collected from markets in Senegal. The quantitative analysis was facilitated by the UniQuant 4 software.
The advantages of measuring thin samples in energy-dispersive X-ray fluorescence are widely acknowledged. Compared to methods utilizing thick samples, thin sample measurements offer several benefits. In the case of thick samples, the rise in the background caused by multiple scattering within the sample introduces absorption and enhancement effects that overshadow the increase in characteristic line intensity due to the thicker sample. Nevertheless, these absorption and enhancement effects are less pronounced in thin samples and can be readily corrected or disregarded [17,19].
The concentrations (mg/kg) of selected metals (Aluminum, Calcium, Potassium, Phosphorus, and Chlorine) in milk samples from the Senegalese market are depicted in Table 1.
| Table 1: Concentrations (ppm) of selected metals (Aluminum, Calcium, Potassium, Phosphorus, and Chlorine) in different milk samples collected from Senegal. | |||||
| Sample | Al | Ca | K | P | Cl |
| H1 | < LOD | 27745.06 ± 310.16 | 46530.57± 517.66 | 13750.94 ± 275.35 | 3374.78 ± 35.44 |
| G1 | < LOD | 31988.84 ± 234.15 | 45015.56 ± 353.56 | 12543.08 ± 262.15 | 3631.04 ± 31.23 |
| D1 | < LOD | 24981.69 ± 254.42 | 35864.07 ± 389.9 | 11859.23 ± 268.16 | 3123.74 ± 34.69 |
| L1 | < LOD | 23068.86 ± 206.41 | 38090.09 ± 349.99 | 11920.51 ± 250.46 | 3106.45 ± 30.25 |
| V1 | < LOD | 25397.82 ± 250.14 | 51058.15 ± 456.13 | 11022.99 ± 240.57 | 3183.96 ± 20.17 |
| Al: Aluminum; Ca: Calcium; K: Potassium; P: Phosphorus; Cl: Chlorine ; LOD: Limit of Detection | |||||
The analysis of metal concentrations in milk samples provides valuable insights into the quality and potential environmental influences on dairy products. Notably, Aluminum (Al) levels were consistently below the limit of detection (LOD) in all samples, indicating negligible presence in the analyzed milk. Calcium (Ca) concentrations varied among the samples, with the highest observed in sample H1, followed by G1, D1, L1, and V1. These variations may be attributed to factors such as the geographical location of the farms, differences in cattle diet, or soil composition. Throughout childhood and adolescence, the body utilizes calcium minerals for the development of robust bones, a process that typically concludes by the age of ten. The accumulation of calcium in the bones diminishes during youth and further declines in old age, particularly impacting women. Young individuals, particularly girls with diets lacking in bone-strengthening nutrients, face an elevated risk of developing osteoporosis—a bone ailment that heightens the likelihood of fractures [20]. Calcium assumes a pivotal role in muscle contraction, nerve signal transmission, and hormone release. When blood calcium levels dip (often due to inadequate dietary intake), the body mobilizes calcium from the bones to ensure cellular functions operate effectively. Both calcium insufficiency and excess can disrupt the body's acid-base balance, leading to issues such as hypercalcemia and various other diseases. Maintaining an optimal balance of calcium intake is critical for overall health and preventing the detrimental effects associated with both deficiency and excess [21].
Potassium (K) concentrations exhibited significant diversity, with sample V1 showing the highest levels. Conversely, samples H1 and D1 demonstrated comparatively lower potassium concentrations, possibly linked to variations in cattle feed or regional soil characteristics. Phosphorus (P) concentrations displayed a notable range, with sample H1 recording the highest levels and V1 the lowest. Understanding the factors influencing phosphorus content is crucial for assessing the nutritional composition of the milk and its implications for human health. Chlorine (Cl) concentrations varied across samples, with G1 exhibiting the highest levels and L1 the lowest. Investigating the sources and implications of chlorine in milk is essential for evaluating its impact on human health, particularly in terms of dietary intake. Chlorine is implicated in various health aspects, including physical fatigue, anorexia, mild forms of diabetes, hypercholesterolemia, and atherosclerosis. Additionally, it plays a role in gout treatment through the consumption of chlorinated mineral waters and aids in regulating bowel movements while stimulating digestion. However, an excess of chlorine can lead to adverse effects such as gastric hyperacidity, the destruction of intestinal microflora, and hypertension [22].
In comparing these results, it becomes evident that the composition of metals in milk is not uniform across different sources as illustrated in Figure 1. These variations may be influenced by factors such as agricultural practices, geographical location, and environmental conditions surrounding the dairy farms.
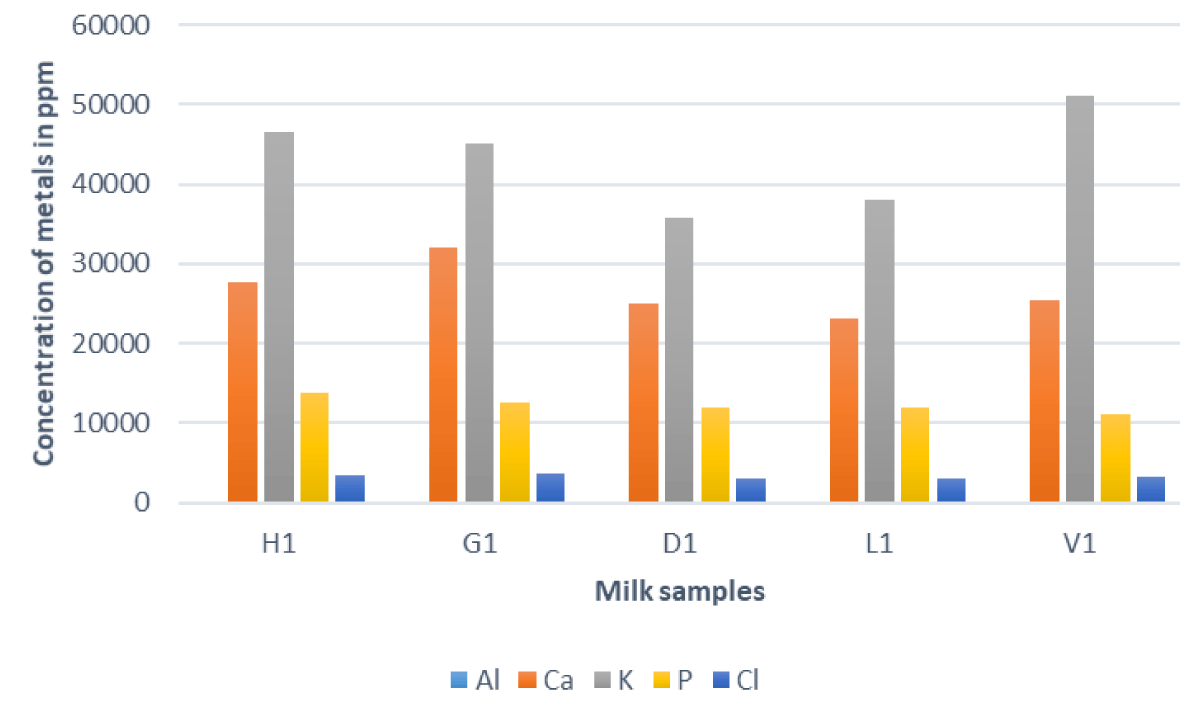
Figure 1: Concentrations of Al, Ca, K, P, and Cl in different milk samples.
Considering the potential health implications of these metal concentrations, further research is warranted to delve into the sources of metals in milk and develop strategies to ensure the safety and quality of dairy products.
In the context of this study, a comparative analysis of the concentrations of elements (P, K, Cl, Al, and Ca) found in the milk samples has been conducted against the Acceptable Maximum Levels (AML) represented in Table 2.
| Table 2: Acceptable Maximum Levels (AML) in ppm of Metals in powdered milk [23]. | |||||
| Metals | K | Ca | Cl | Al | P |
| AML (ppm) | 3,500 | 2,500 | 3,400 | 867 | 1,000 |
This approach aims to assess the conformity of the obtained results with established standards, providing crucial insights into the quality and safety of the examined samples.
In Figure 2, the distribution of potassium concentrations in the analyzed milk samples is vividly illustrated. Notably, the maximum potassium value, as recorded in this study, is observed in sample V1. Upon careful examination, it is evident that both sample V1 and samples H1, D1, and L1 exhibit potassium concentrations more than three times higher than the Acceptable Maximum Level (AML) set at 3,500 ppm.
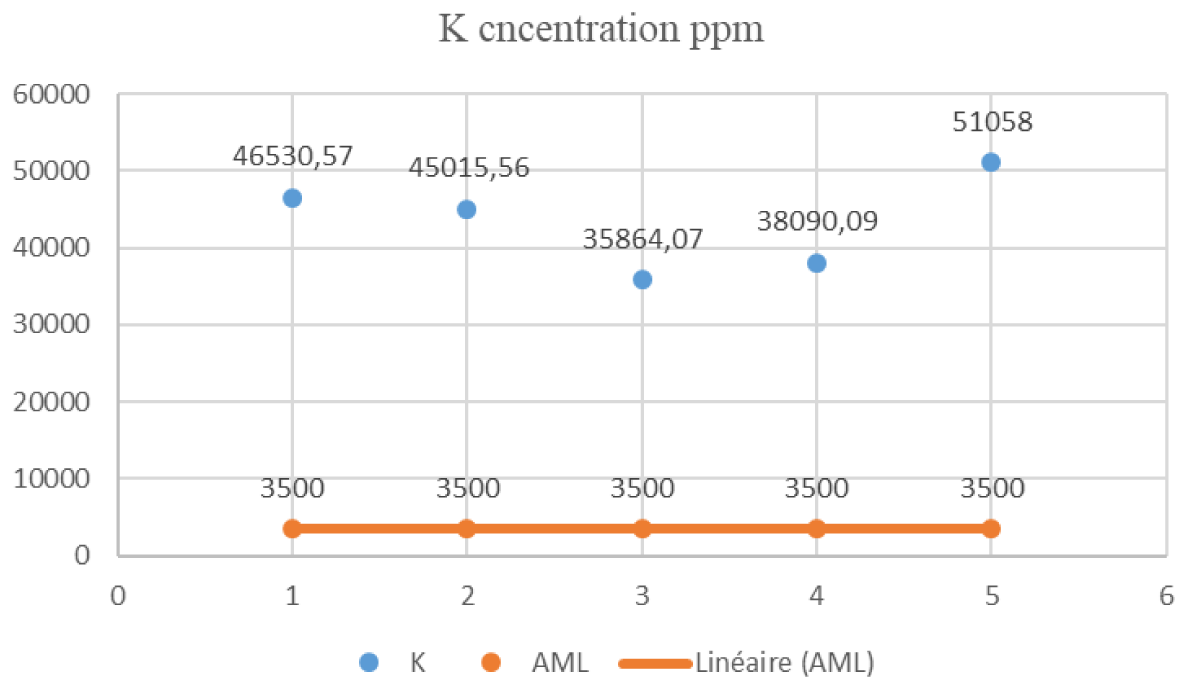
Figure 2: Distribution of K Concentrations in Milk Samples.
Furthermore, sample G1 stands out with a potassium level of 51,058.15 ppm, significantly exceeding the AML. This emphasizes the importance of monitoring and evaluating metal concentrations in milk, particularly potassium, which can have implications for dietary intake. Conversely, sample V1 displays a potassium level of 11,022.99 ppm, which is below the AML. This observation positions sample V1 within the acceptable limits prescribed by current legislation for potassium levels in milk. This distribution analysis provides a visual representation of metal concentrations across different samples, highlighting the notably elevated potassium levels in samples G1 and V1. The substantial excess of potassium in sample G1, exceeding the Acceptable Maximum Level (AML), emphasizes the importance of regulatory compliance. Additionally, the elevated potassium levels observed in various samples underscore the need for further investigation into potential health implications associated with these concentrations in milk.
The results continue to highlight the significant deviations from regulatory standards. While potassium concentrations in sample G1 raised concerns, the evaluation of calcium concentrations in samples H1, G1, D1, L1, and V1, represented in Figure 3, reveals an even more pronounced departure from the Acceptable Maximum Level (AML) of 2500 ppm.
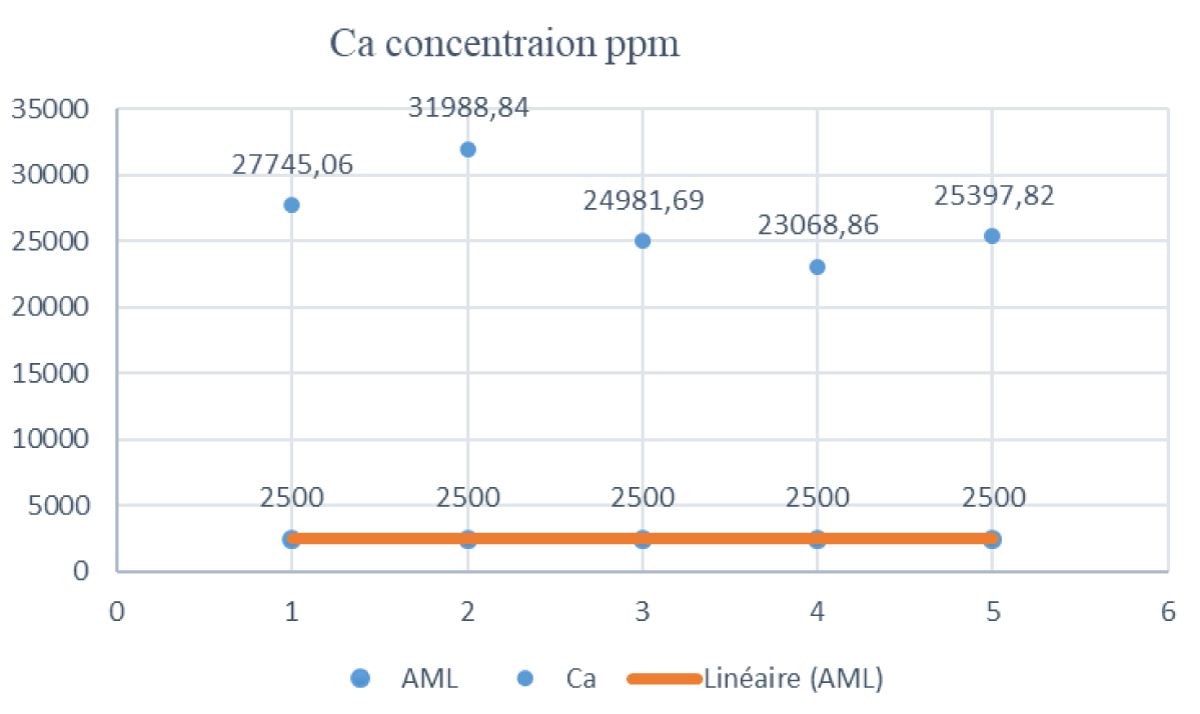
Figure 3: Distribution of Calcium Concentrations in Milk Samples.
The results indicate that the calcium concentrations in samples H1, G1, D1, L1, and V1 are consistently above the AML. Sample H1 recorded the highest levels at 27,745.06 ppm, surpassing the AML approximately 11.1 times. Similarly, sample G1 exceeds the AML about 12.8 times, sample D1 about 10.0 times, sample L1 about 9.2 times, and sample V1 about 10.2 times. This observation raises significant concerns regarding regulatory compliance, as these concentrations significantly exceed the established limit. While calcium is an essential nutrient, elevated levels in milk may have dietary implications. The discrepancy between observed concentrations and regulatory limits underscores the need for closer scrutiny of calcium content in milk and the potential health implications associated with excessive intake. It is crucial to consider these findings in the context of dietary recommendations and regulatory standards to ensure the safety and quality of dairy products. Further research is warranted to understand the sources of elevated calcium levels and to develop strategies for maintaining optimal nutrient composition in milk without compromising regulatory guidelines. The existing data robustly endorse recommendations for a daily calcium intake ranging from 1,200 to 1,500 mg for this specific age group [24].
The concentrations of chlorine (Cl) in the analyzed milk samples were meticulously assessed with respect to regulatory standards, specifically the Acceptable Maximum Level (AML) set at 3,400 ppm. To provide a comprehensive visual representation of the distribution of chlorine concentrations, Figure 4 illustrates the distribution of Cl concentrations in each sample.
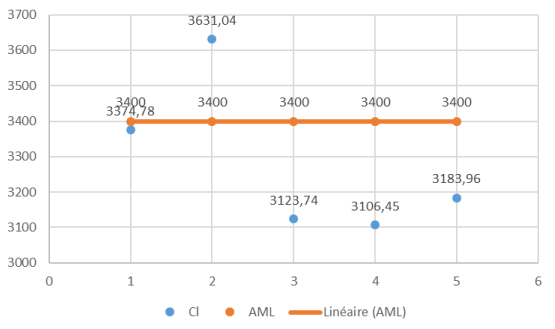
Figure 4: Distribution of Chlorite Concentrations in Milk Samples.
Results indicate that chlorine concentrations in samples H1, D1, L1, and V1 are below the AML. However, sample G1 recorded the highest chlorine concentration at 3631.04 ppm, slightly exceeding the AML. While chlorine is an essential element and commonly present in water and food, maintaining concentrations within regulatory limits is crucial for safety and environmental considerations. The compliance observed in other samples is encouraging from a regulatory standpoint, and further research could explore the environmental impact of chlorine levels in milk. This analysis provides valuable insights into the regulatory compliance of chlorine concentrations in milk, contributing to our understanding of the overall composition and safety of dairy products.
Figure 5 represents the distribution of phosphorus concentrations in milk samples. The phosphorus (P) concentrations in the analyzed milk samples were thoroughly examined in relation to regulatory standards, specifically the Acceptable Maximum Level (AML) set at 1,000 ppm.
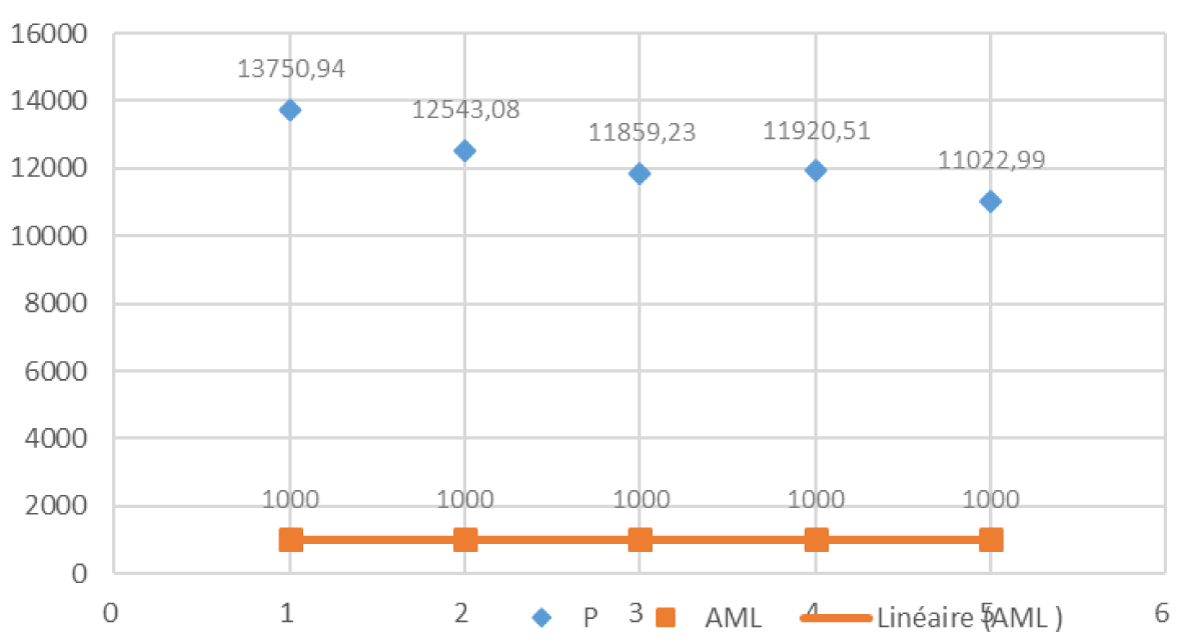
Figure 5: Distribution of phosphorus Concentrations in Milk Samples.
Figure 5 illustrates the phosphorus concentrations in samples H1, G1, D1, L1, and V1. Results reveal that the phosphorus concentrations in these samples vary, with sample H1 recording the highest concentration at 13,750.94 ppm, significantly surpassing the AML. This notable deviation from regulatory standards in sample H1 underscores the importance of scrutinizing and addressing elevated phosphorus levels in milk. The distribution analysis visually emphasizes the magnitude of the deviation observed in phosphorus concentrations, providing valuable insights into the overall safety and quality of dairy products. Compliance with regulatory standards is crucial for ensuring the integrity of milk, and deviations, as highlighted in sample H1, warrant further investigation and corrective measures. While phosphorus is an essential element, maintaining concentrations within acceptable limits is vital for both safety and regulatory adherence. This analysis contributes to our understanding of the regulatory compliance of phosphorus concentrations in milk, paving the way for continued discussions on refining standards and ensuring the safety of dairy products.
This comprehensive study sheds light on the intricate interplay between metal concentrations in milk and established regulatory standards. The deviations observed in potassium, calcium, chlorine, and phosphorus levels underscore the need for ongoing scrutiny, to ensure both the safety and quality of dairy products. The presence of heavy metals in milk is influenced by factors such as species variations, geographic location, production methods, and contamination of equipment depending on the specific processes involved [25].
These findings contribute to the broader dialogue on refining regulatory standards and maintaining a delicate equilibrium between essential nutrients and adherence to safety guidelines in our food supply.
This comprehensive study, utilizing X-ray Fluorescence (XRF), investigated heavy metal concentrations in five powdered milk samples (V1, L1, H1, G1, and D1) from Senegal. The analysis focused on aluminum (Al), calcium (Ca), potassium (K), phosphorus (P), and chlorine (Cl). Aluminum was either undetected or found at negligible levels in all samples, highlighting the quality of the milk regarding this metal. However, concerns arise from the consistently high calcium levels in all samples, especially in H1, where it exceeded the Acceptable Maximum Level (AML) by approximately 11.1 times. The study reveals variable potassium levels, with G1 exhibiting significantly elevated values above the AML. While chlorine concentrations generally complied with the AML, G1 showed a slight deviation. The notably higher phosphorus levels in H1 underscore the importance of closely monitoring these components for food safety. The non-uniformity among samples emphasizes the need to consider factors such as geographical location and agricultural practices, influencing the metal composition of powdered milk. Enhanced quality control measures, regular testing, public awareness campaigns, and collaboration with producers are recommended to ensure the safety and quality of powdered milk in Senegal. This proactive approach aligns with international standards and contributes to addressing emerging challenges, thereby safeguarding public health and maintaining regulatory compliance in the food supply chain.
- Dror DK, Allen LH. Dairy product intake in children and adolescents in developed countries: trends, nutritional contribution, and a review of association with health outcomes. Nutr Rev. 2014 Feb;72(2):68-81. doi: 10.1111/nure.12078. Epub 2013 Dec 13. PMID: 24330063.
- Tamime AY. Dried milk products. Dairy powders and concentrated milk products. Oxford, U.K.: Blackwell Pub. Ltd. 2009; 231-245.
- Claeys WL, Cardoen S, Daube G, De Block J, Dewettinck K, Dierick K, De Zutter L, Huyghebaert A, Imberechts H, Thiange P, Vandenplas Y, Herman L. Raw or heated cow milk consumption: review of risks and benefits. Food Control. 2013; 31(1):251-262. doi: 10.1016/j.foodcont.2012.09.035
- Chandan RC, Kilara A, Shan NP. Dairy Processing and Quality Assurance. Wiley-Blackwell 2015.
- FAO and WHO, Codex Alimentarius: Milk and Milk Products. Second Edition, Food and Agriculture Organization of the United Nations and World Health Organization, Rome, 2011.
- EC (European Commission). Overview of Microbiological Criteria for Foodstuffs in Community Legislation in Force. https://ec.europa.eu/food/safety/biological
- Dudriková E, Pol’aková L, Pukáčová J. Health and hygienic conditions of Ewe’s milk processing from the aspect of food safety. Potravinarstvo. 2010; 4(3):14-18. doi: 10.5219/24
- Tamime AY. Milk Processing and Quality Management. Wiley-Blackwell, Chichester, UK, 2008.
- Aumaître A. Quality and safety of animal products. Livestock Production Science. 1999; 59(2-3):113-124.
- Saracoglu S, Saygi OK, Uluozlu OD, Tuzen M, Soylak M. Determination of trace element contents of baby foods from Turkey. Food Chem. 2007; 105: 280.
- Nabrzyski M, Gajewska R. Content of strontium, lithium and calcium in selected milk products and in some marine smoked fish. Die Nahrung. 2002: 46: 204-208.
- Kira CS, Maihara VA. Determination of major and minor elements in dairy products through inductively coupled plasma optical emission spectrometry after wet partial digestion and neutron activation analysis. Food Chemistry. 2007; 100(1):390-395.
- Ay U, Karayünlü S. Modification in direct analysis method: metal levels in raw milk at the region of Izmit by graphite furnace atomic absorption spectrophotometer. International Journal of Food Science and Technology. 2008; 43:326-329.
- Pashkova GV. X-ray fluorescence determination of element contents in milk and dairy products. Food Analytical Methods. 2009; 2(4):303-310.
- Gunicheva TN. Advisability of X-ray fluorescence analysis of dry residue of cow milk applied to monitor environment. X- Ray Spectrometry. 39(1):22–27.
- Al Maliki A, Al-lami AK, Hussain HM, Al-Ansari N. Environ Earth Sc. Comparison between inductively coupled plasma and X-ray fluorescence performance for Pb analysis in environmental soil samples. 2017; 76: 433: DOI 10.1007/s12665-017-6753-z
- Faye PM, Dione D, Ndiaye N, Mamadou Faye ON, Traore A, Ndao AS. IOSR Journal of Applied Physics (IOSR-JAP). 2024; 16.
- Dione D. International Journal of Innovation Scientific Research and Review. Characterization and qualitative and quantitative analysis of soil samples by the analytical method of x-ray fluorescence spectrometry: case of the agricultural site of niakhene-senegal. 2024; 06: 5705-5712.
- Rouillon M, Taylor MP. Can field portable X-ray fluorescence (pXRF) produce high quality data for application in environmental contamination research? Environ Pollut. 2016 Jul;214:255-264. doi: 10.1016/j.envpol.2016.03.055. Epub 2016 Apr 19. PMID: 27100216.
- Bălălău OD, Bacalbașa N, Olaru OG, Pleș L, Stănescu DA. Vaginal birth after cesarean section – literature review and modern guidelines. J Clin Invest Surg. 2020; 5(1):13-17. doi: 10.25083/2559.5555/5.1/13.17.
- Magdalena M, Lucian H, Emma AO, Daniela LB, Ioana P, Oana DB. Analysis of potentially toxic contaminants in milk powder. Journal of Mind and Medical Sciences. 2021; 8.
- FAO and WHO. Codex Alimentarius, Standard for Whole Milk Powder, Partly Skimmed Milk Powder and Skimmed Milk Powder (A-5-1971) Adopted in 1999. Amended in 2010, 2013, 2014, 2016, 2018.
- Health and Safety Executive. EH40/2005 Workplace Exposure Limits 2005. London: The Stationery Office; 2005. https://www.hse.gov.uk/pubns/books/eh40.htm
- Motofei IG Rowland DL, Baconi DL, Georgescu SR, Paunica S, Constantin VD, Balalau D, Paunica I, Balalau C, Baston C, Sinescu I. Therapeutic considerations related to finasteride administration in male androgenic alopecia and benign prostatic hyperplasia. Farmacia. 2017; 65(5):660-666.
- Parisa Z, Faezeh S, Mahdieh M, Maryam TZ. Acta Scientific Pharmaceutical Sciences. An Overview of the Heavy Metal Contamination in Milk and Dairy Products. 2019; 2.