
More Information
Submitted: December 13, 2023 | Approved: April 04, 2024 | Published: April 05, 2024
How to cite this article: Olegario MM, Chinchay-Barragán CE, José Francisco MP, Jessica Blanca VA, José Ambrosio MM, et al. Statistical Mathematical Analysis of COVID-19 at World Level. Int J Phys Res Appl. 2024; 7: 040-047.
DOI: 10.29328/journal.ijpra.1001082
Copyright License: © 2024 Olegario MM, et al. This is an open access article distributed under the Creative Commons Attribution License, which permits unrestricted use, distribution, and reproduction in any medium, provided the original work is properly cited.
Keywords: Estimation; Logistic model; Global pandemic COVID-19; Validation

Statistical Mathematical Analysis of COVID-19 at World Level
Marín-Machuca Olegario1* , Carlos Enrique Chinchay-Barragán2, Moro-Pisco José Francisco3, Vargas-Ayala Jessica Blanca4, Machuca-Mines José Ambrosio5, María del Pilar Rojas-Rueda6 and Zambrano-Cabanillas Abel Walter7
1Professional School of Food Engineering, Faculty of Oceanography, Fisheries, Food Sciences and Aquaculture (FOPCA), Environmental Sustainability Research Group (GISA), Graduate University School (EUPG), Federico Villarreal National University, Lima, Perú
2Professional School of Food Engineering, Faculty of Fisheries and Food Engineering, National University of Callao, Callao, Peru
3Professional School of Mechatronics Engineering, Faculty of Electronic Engineering and Informatics, Federico Villarreal National University, Lima Peru
4Professional School of Engineering in Aquaculture, Faculty of Oceanography, Fisheries, Food Sciences and Aquaculture, Federico Villarreal National University, Lima, Peru
5Faculty of Engineering and Management, National Technological University of South Lima, Lima Perú
6Faculty of Health Sciences, Academic Professional School of Human Medicine, Norbert Wiener University, Norbert Wiener University, Lima, Peru
7Professional School of Aquaculture Engineering, Faculty of Oceanography, Fisheries, Food Sciences and Aquaculture, Federico Villareal National University, Lima, Peru
*Address for Correspondence: Marín-Machuca Olegario, Professional School of Food Engineering, Faculty of Oceanography, Fisheries, Food Sciences and Aquaculture (FOPCA), Environmental Sustainability Research Group (GISA), Graduate University School (EUPG), Federico Villarreal National University, Lima, Perú, Email: [email protected]
Worldwide, statistical data of people infected by COVID-19 has been taken until March 29, 2023, which, when correlated, showed a predictive logistic model. The purpose was to determine the predictive model, which was acceptable, in such a way that the proportionality constant and the correlation and determination coefficients are of great importance to estimating epidemiological and pandemic data; coinciding with what was reported by other authors. Bearing in mind that a mathematical model is a mathematical description through a function or equation of a phenomenon in the real world; whose purpose is to understand infections and make predictions for the future. The stages were: to model the number of people infected as a function of time, formulate, and choose the logistic model, determine the model and obtain mathematical conclusions, and make predictions (estimates) about the number of people infected by COVID-19 worldwide. The logistic model was derived to predict the speed of people infected by COVID-19 and the critical time (tc = 733 days) for which the speed was maximum (1694,7209 infected/day). The Pearson correlation coefficient for the time elapsed (t) and the number of people infected (N) worldwide, based on 32 cases, was r = -0.88; the relationship between time and those infected is real, there is a “very strong correlation” between the time elapsed (t) and the number of people infected (N) and 77.03% of the variance in N is explained by t.
The behavior and analysis of COVID-19 until March 29 of the present, determine the statistical and mathematical model, critical time (days) in which the greatest contagion occurred, find the speed with which the pandemic developed, validate the estimated data; along with other global public health indicators; they constitute a true problem of prevention, which surely serve as reference data to face other similar global health problems. The transmission of COVID-19 increases in the presence of cold air and low humidity [1] noting that droplets of saliva expelled by people carrying the virus when talking and sneezing can spread the disease by becoming airborne [2]. It has been found that, in open environments, atmospheric turbulence can make it easier for them to stay suspended for longer and be transported over greater distances [3,4]. On March 6, 2020, the first confirmed case of coronavirus was reported in Peru; and since then, the progress of the pandemic has been evaluated by the Ministry of Health (MINSA) and reported to the public [5]. This virus is now known as severe acute respiratory syndrome coronavirus 2 (SARS-CoV-2) and the disease it causes is called COVID-19; in March 2020 the World Health Organization (WHO) declared this outbreak of COVID-19 a pandemic [6].
Zhou [7] mentions that the seventh HCoV to be discovered is SARS-CoV-2, the cause of an outbreak, called COVID-19, which is currently spreading throughout the world, which started in Wuhan, a city of more than eleven million inhabitants, in Hubei province, in central China. The incubation period in 95% of the cases was reported to be less than fourteen days, which supports a fourteen-day quarantine period [7,8].
The presence of many undiagnosed mild infections limits efforts to control and continue the spread of this virus and convinced that the rapidity of the spread is high compared to the 2003 SARS-CoV outbreak, suggesting that SARS-CoV-2 is much more transmissible than SARS-CoV [9,10].
It is currently accepted that contagion among asymptomatic subjects has been the main cause of the enormous extension and spread of the SARS-CoV-2 pandemic [11,12]. Experimental studies have shown that the virus can persist viable for at least three hours in aerosols, twenty-four hours on cardboard, and up to seventy-two hours on plastic or stainless-steel surfaces; detected in the gastrointestinal tract, feces, saliva, and urine, potential transmission routes that need to be evaluated soon [13]. The most frequent symptoms at the time of the entry of the virus in all cases are fever, asthenia, and cough and, in the Wang & Cowled [14] series, fever was the most common symptom, while in Guan, et al. [15] noted that only 43.8% of the patients had fever at the time of admission, although the vast majority developed it during their hospital stay. Additionally, Yang, et al. [16] refer to the fact that 11% of critically ill patients did not present fever at the onset of symptoms and the radiological pattern was alveolar infiltrate. The greatest experience with COVID-19 comes from the outbreak in China and in this context, 80% of confirmed cases had mild to moderate symptoms (including cases of mild pneumonia), 13.8% had a severe clinical course (dyspnea, tachypnea ≥ 30/min, saturation O2 ≤ 93%, PaO2 /FiO2 ≤ 300, and pulmonary infiltrates ≥ 50 % of the radiological fields in 24% - 48%) and 6.1% presented a critical course (respiratory failure, septic shock and/or multiple organ failure), concluding that in this situation the percentage of asymptomatic people could not be determined [17].
Possible risk factors were considered: age, sex, the smoker at the time of infection, chronic obstructive pulmonary disease, coronary disease, diabetes, arterial hypertension, carcinoma, chronic kidney disease, and other comorbidities; In addition, in the univariate study, the variables were significantly associated with higher mortality: age, coronary disease, diabetes, and hypertension [17]. There are other ways to model atypical COVID-19 phenomena such as System Dynamics Modeling (SDM), Agent-Based Modeling (ABM), and Discrete Event Simulation (DES), and their hybrids in COVID-19 research, which identify theoretical and application innovations in public health [18]. The basic reproduction number of the model using the new generation matrix method, the local and global stability analysis is carried out for both the disease-free and endemic equilibrium states; where the model is validated with real data of cumulative COVID-19 cases in the Republic of India between January 1 and April 30, 2022 [19,20]. Arora, et al. mention that the Long- and Short-Term Memory (LSTM) model has a minimum error in predicting daily and weekly cases, observing that the proposed method offers great precision in short-term prediction. Other ways of processing statistical data are through the Internet of Things (IoT) fields, with great potential for application in the health sector, where, based on the monitoring of physiological variables of interest, the identification and early diagnosis of diseases is possible. diseases with silent symptoms from home [21]. Studies have been carried out to forecast, in the long term, the cumulative number of confirmed cases and deaths from COVID-19 per million inhabitants from the first confirmed case to day 350 in each South American country, using the logistic growth model with three parameters observing that the parameters of the logistic models in each country were significant, representing their projections and presenting the real values on the projected logistic curve in each country [22]. Available evidence suggests that medical comorbidities such as obesity, diabetes, and old age are risk factors for COVID-19 [23,24]. The most updated epidemiological data of COVID-19 before June 16, 2020, should be integrated into the logistic model to adjust the epidemic trend boundary [25,26]. Vargas, et al. [27] maintain that COVID-19 has caused a severe pandemic worldwide, causing great panic and universal alarm and deaths; generating a collapse of the health system in many countries around the world. In mid-2022, an outbreak of COVID-19 occurred in several countries outside of European regions, where these outbreaks usually occur like monkeypox [28]. Monkeypox is a different disease than COVID-19 but can be modeled logistically, like the COVID-19 disease [29,30]. The identification of COVID-19, practically, was discovered by the massification of cases in a short time and quickly spread to several countries in the world, causing deaths in three weeks [31,32].
The evolution of contagion throughout the world, by COVID-19, until November 5, 2022, in determining the highest mortality, statistical mathematical modeling, critical time (days), the speed with which contagion developed, validation of predictive data; along with other global public health indicators; they constitute a real problem of prevention, which surely serve as reference data to face other similar public health problems.
A logistic mathematical model is a tool that helps us to analyze and predict the problems produced by diseases and whose objective is to describe, explain, and estimate epidemiological phenomena in defined geographical areas, to understand the dynamics of dispersion and in this case of mortality due to the disease in various settings; needing to model, using the necessary tools [33].
Marín-Machuca, et al. [34] mention that the modeling for COVID-19 was based on determining the relationship between the variation in the number of infections reported (dN) and the variation of the elapsed time (dt), called the speed with which the reported infections occurred in China, with the purpose of finding a relationship that adequately estimates the infections by COVI-19, the predictive logistic model was obtained. Manrique-Abril, et al. [35] and [36] mention that mathematical modeling cases that have the form is induced to evaluate the values of the constant of proportionality (k) or rate of change of the contagious phenomenon. The importance of logistic models is that estimates and aspects of mathematical analysis such as derivation, integration, and even optimization of bivariate transfer functions are carried out. Other important topics are modeling logical processes, formulating, and choosing the appropriate logistic model, obtaining valuable conclusions, and making future estimates on different real-world cases. The innovations of the logistic model lie in that it allows us to estimate and highlight the number, rhythm, and acceleration of deaths from the COVID-19 disease worldwide.
The lack of applying the statistical, mathematical, logistical, and validation knowledge of parameters and variation factors to relate, estimate or predict, correlate, and specify data of elapsed time (dates of phenomena events); leads to an imminent scientific vacuum.
The objectives of the present study were to analyze the behavior of the SARS-CoV-2 pandemic, which caused the COVID-19 disease, compare the representations between infected people and people estimated to be infected, estimate the critical time (days) for the maximum speed estimate of infections and statistically validate the reliability of the models.
Statistical data
The COVID-19 data were taken from the National Death Information System (SINADEF) [37] and the accumulated cases of infected people in Peru based on the time elapsed (days) are presented in Table 1. Determining the behavior of the statistical data on the number of people who died from COVID-19 worldwide, the methodology and procedure were applied.
| Table 1: Statistical data on the number of people infected by COVID-19 worldwide, based on the time elapsed (days). | ||
| Date | Time, t (days) | N (accumulated cases) |
| 22/01/2020 | 0 | 555 |
| 29/02/2020 | 22 | 6167 |
| 07/04/2020 | 76 | 1399055 |
| 15/05/2020 | 114 | 4548277 |
| 22/06/2020 | 152 | 9071294 |
| 30/07/2020 | 190 | 17302946 |
| 06/09/2020 | 228 | 27145595 |
| 14/10/2020 | 266 | 38543448 |
| 21/11/2020 | 304 | 58268894 |
| 29/12/2020 | 342 | 81951541 |
| 05/02/2021 | 380 | 105392577 |
| 15/03/2021 | 418 | 120218060 |
| 22/04/2021 | 456 | 144742651 |
| 30/05/2021 | 494 | 170348523 |
| 07/07/2021 | 532 | 185075852 |
| 14/08/2021 | 570 | 206807509 |
| 21/09/2021 | 608 | 229535001 |
| 29/10/2021 | 646 | 246025709 |
| 06/12/2021 | 684 | 266468058 |
| 13/01/2022 | 722 | 320038386 |
| 20/02/2022 | 760 | 424508594 |
| 30/03/2022 | 798 | 486561386 |
| 07/05/2022 | 836 | 517097886 |
| 14/06/2022 | 874 | 536638333 |
| 22/07/2022 | 912 | 569010828 |
| 29/08/2022 | 950 | 601172684 |
| 06/10/2022 | 988 | 620393182 |
| 03/11/2022 | 1016 | 631708456 |
| 05/12/2022 | 1048 | 645718635 |
| 13/01/2023 | 1087 | 666463476 |
| 22/02/2023 | 1127 | 674458488 |
| 29/03/2023 | 1164 | 678455994 |
| Source: State of Health [40]. | ||
The methodology used was based on the specific growth constant (k), where the conditions of the process will exercise restrictions on the number of infections with COVID-19 worldwide, bearing in mind that the constant k will decrease as the infections increase. They increase because the k of infections (grows or decreases) only depends on the number of people and not on time-dependent mechanisms, such as non-seasonal phenomena; arriving to determine a logistic equation whose solution is a logistic function. Bearing in mind that a mathematical model is a mathematical description, through an equation, of a real-world phenomenon, such as the number of infections with COVID-19 worldwide; whose purpose is to understand contagions and make predictions regarding future behavior. The stages covered were: 1) the problem of modeling the number of infections as a function of time, 2) formulating and choosing, through the dispersion of the data, the logistic model, 3) determining the model, analyzing it and drawing mathematical conclusions, and 4) make predictions about the number of infections by COVID-19 worldwide. Bearing in mind that a mathematical model is never a fully accurate representation, that it is only an idealization, that it simplifies the number of COVID-19 infections worldwide, and that it is accurate enough to promote valuable conclusions and relevant discussions.
Procedure
Having determined the behavior of the number of people infected by COVID-19 worldwide, it has been determined that the model describes a logistic dispersion of the type … (1) where ″M″ is the maximum number of infected, ″Q″ a pre-exponential amount, ″k″ constant of proportionality, ″t″ is the elapsed time (days) and ″N″ the number of people infected.
The procedure was developed following the steps:
1. To determine the predictive mathematical model of people infected by COVID-19 worldwide, we have based ourselves on the Empirical Modeling theory of Bronshtein & Semendiaev [38].
2. The way to calculate the maximum probable value (M) is by considering three independent random values and their corresponding dependent values from the database and derived by the formula: (2)
3. The first value (A) is the value of the dependent variable, which corresponds to the independent variable (t1); being this value at the instant that the behavior presents a turning point (value very close to half of the last data of the dependent variable), the second value (B) will be the value of the dependent variable that corresponds to the last date of the independent variable (t2) y el tercer valor (I), is the value of the dependent variable that corresponds to the semi-sum of the independent variables t1 and t2; named: t3 = t1 + t22.
4. The value M is replaced with the logistic model.
5. The logistic model is mathematically linearized, to which the method of least squares is applied. (MMC), takes the form: what is a linear equation: y = A + Cx; where x = t y A = lnQ.
6. The linear regression statistical process can be performed on a computer or scientific calculator, entering the ordered pairs (x, y) i the form: .
7. Having introduced all the ordered pairs, we look up the values of lnQ y k.
8. The value of k is the value of the slope of the linear equation; that is, the value of ″C″ from the linear equation: y = A + Cx; the value of A is lnB and therefore Q = eA, and from the same regression analysis, we evaluated the correlation coefficient, Pearson's r; thus, determining the logistic model. To estimate the rate of infection (persons infected/day) by COVID-19 worldwide, the logistic model is derived, a relationship that takes the form (3); estimating the , by COVID-19, worldwide
9. To determine the critical time (tc) for which the number of people infected by COVID-19 worldwide will be the maximum value, expression (3) is derived, equaled to zero, obtaining.
10. The expression n (4); determining the critical time by which the maximum number of people infected by COVID-19 has occurred worldwide.
As of March 29, 2023, around 678 million cases of coronavirus infection (SARS-CoV-2) have been registered in the world, causing the disease COVID-19, which originated in the city of Wuhan (China), extending to all countries of the world. The accumulated cases of infected people worldwide based on the time elapsed (days) are presented in Table 1.
The research has not differentiated whether the COVID-19 disease worldwide was spread by air or by contact and therefore there is a single coefficient for the model, whose margin of error is 0.12 or 12%; calculated by linearized logistic regression analysis.
Statistical treatment: Hernández, et al. [39], mention that the statistical treatment of correlated bivariate data implies determining the validity of the mathematical models through the correlation and determination coefficients, validated by the significance test of the Pearson r correlation coefficient, which one wants to know if the value of r represents a real relationship between the two variables. The standard error of r is evaluated by,
(5)
The Student's t (tcal)t will be compared with the t of table (tcal) to conclude the relationship between the elapsed time, t (days), and the number of infections N (people), the degree of difference and the estimation of the model and the interpretation of the correlation coefficients (r) and determination (r2>) of the predictive logistic models.
The results were obtained in accordance with the procedure, including the calculation of the parameters prior to the mathematical model, the logistic regression analysis to determine the parameters of the mathematical model, and the ordinary derivation to determine the model to estimate the speed of people infected by COVID-19 worldwide. The logistic model was compared with other models, such as the Gompertz model, the graphic differentiation model, and the SIR model; among others, deciding to apply logistics because it is factual. The limitations of the logistic model are based on the specific growth constant (k), where the conditions of the process will exert restrictions on the number of COVID-19 infections worldwide, keeping in mind that the constant k will decrease as the infections increase and assuming that the k of infections (increases or decreases) only depends on the number of people and not on time-dependent mechanisms, such as non-seasonal phenomena and others. Considering that a mathematical model is a mathematical description of the number of COVID-19 infections worldwide; whose purpose is to understand contagions, make predictions regarding future behavior, and propose valuable conclusions and relevant discussions.
To determine the predictive logistic model of the number of cases infected by COVID-19 worldwide, we have based ourselves on the Empirical Modeling theory [38] on the number of reported cases (N), as a function of time elapsed, t, (days). The behavior (Figure 1) of the statistical data (Table 1) of the number of people infected by COVID-19, has been considered the model of the type . The development is as follows:
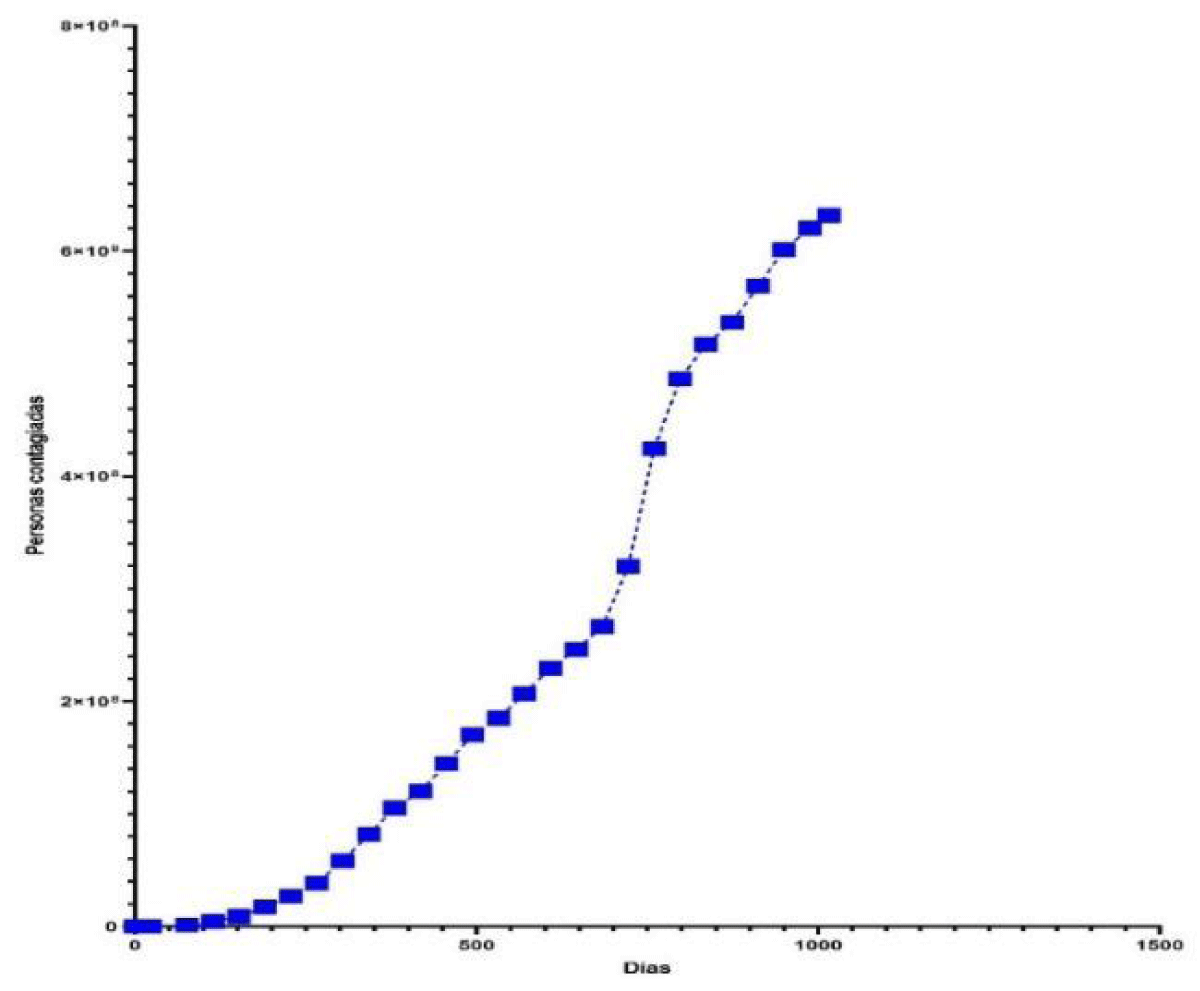
Figure 1: The behavior of the number of people infected by COVID-19 worldwide, depending on the time elapsed (days).
First Value: t1 = 722 days, it corresponds to A = 320038386 people infected
Second Value: t2 = 1164 days, it corresponds to B = 678455994 people infected
Third Value: , it corresponds to I = 595842934 people infected
Now, we substitute in (2):
The model it can be written
Applying the method of least squares to the expression we obtain the estimation model,
(6)
With a correlation coefficient r = -0,88.
Deriving equation (6), the equation for estimating the speed of infected people is obtained, expressed by equation (7),
(7)
Deriving equation (4) and equating it to zero, it is possible to determine the critical time (tc) for which the speed of the estimated infected people is maximum,
(4)
The critical time is tc = 733 days, produced on January 24, 2022, the date on which there was the maximum rate of infection of 1694.7209 infected/day. The estimated number of people infected by COVID-19 is determined by equation (6) as shown in Table 2 and represented in Figure 2. The rate of change or speed of estimated people infected by COVID-19, worldwide, is determined by equation (7) and represented in Figure 3.
| Table 2: Numbers of persons infected, estimated numbers of persons infected, and speed of deaths estimated by COVID-19, globally, as a function of elapsed time (days). | |||
| Time, t (days) | N (accumulated cases) | ||
| 0 | 555 | 673278 | 6.3882 |
| 38 | 6 167 | 965598 | 9.1580 |
| 76 | 1 399 055 | 2384591 | 13.1241 |
| 114 | 4 548 277 | 1984886 | 18.7983 |
| 152 | 9 071 294 | 2844404 | 26.9060 |
| 190 | 17 302 946 | 4073988 | 38.4703 |
| 228 | 27 145 595 | 5830740 | 54.9229 |
| 266 | 38 543 448 | 8336128 | 78.2446 |
| 304 | 58 268 894 | 11899949 | 111.1312 |
| 342 | 81 951 541 | 16950749 | 157.1604 |
| 380 | 105 392 577 | 24071783 | 220.9029 |
| 418 | 120 218 060 | 34038244 | 307.8500 |
| 456 | 144 742 651 | 47844879 | 423.9311 |
| 494 | 170 348 523 | 66702235 | 574.2815 |
| 532 | 185 075 852 | 91965540 | 760.8762 |
| 570 | 206 807 509 | 124949622 | 978.9339 |
| 608 | 229 535 001 | 166594250 | 1212.8949 |
| 646 | 246 025 709 | 217003535 | 1434.3544 |
| 684 | 266 468 058 | 275000235 | 1605.4939 |
| 722 | 320 038 386 | 337952584 | 1689.9497 |
| 760 | 424 508 594 | 402109399 | 1667.5174 |
| 798 | 486 561 386 | 463427471 | 1543.7080 |
| 836 | 517 097 886 | 518539414 | 1347.0535 |
| 874 | 536 638 333 | 565403734 | 1116.2420 |
| 912 | 569 010 828 | 603413506 | 886.1163 |
| 950 | 601 172 684 | 633076320 | 679.8178 |
| 988 | 620 393 182 | 655536536 | 508.0353 |
| 1016 | 631 708 456 | 668273297 | 404.6560 |
| 1048 | 645718635 | 679632442 | 308.8164 |
| 1087 | 666463476 | 689851346 | 219.6631 |
| 1127 | 674458488 | 697241828 | 153.4550 |
| 1164 | 678455994 | 702063676 | 109.4744 |
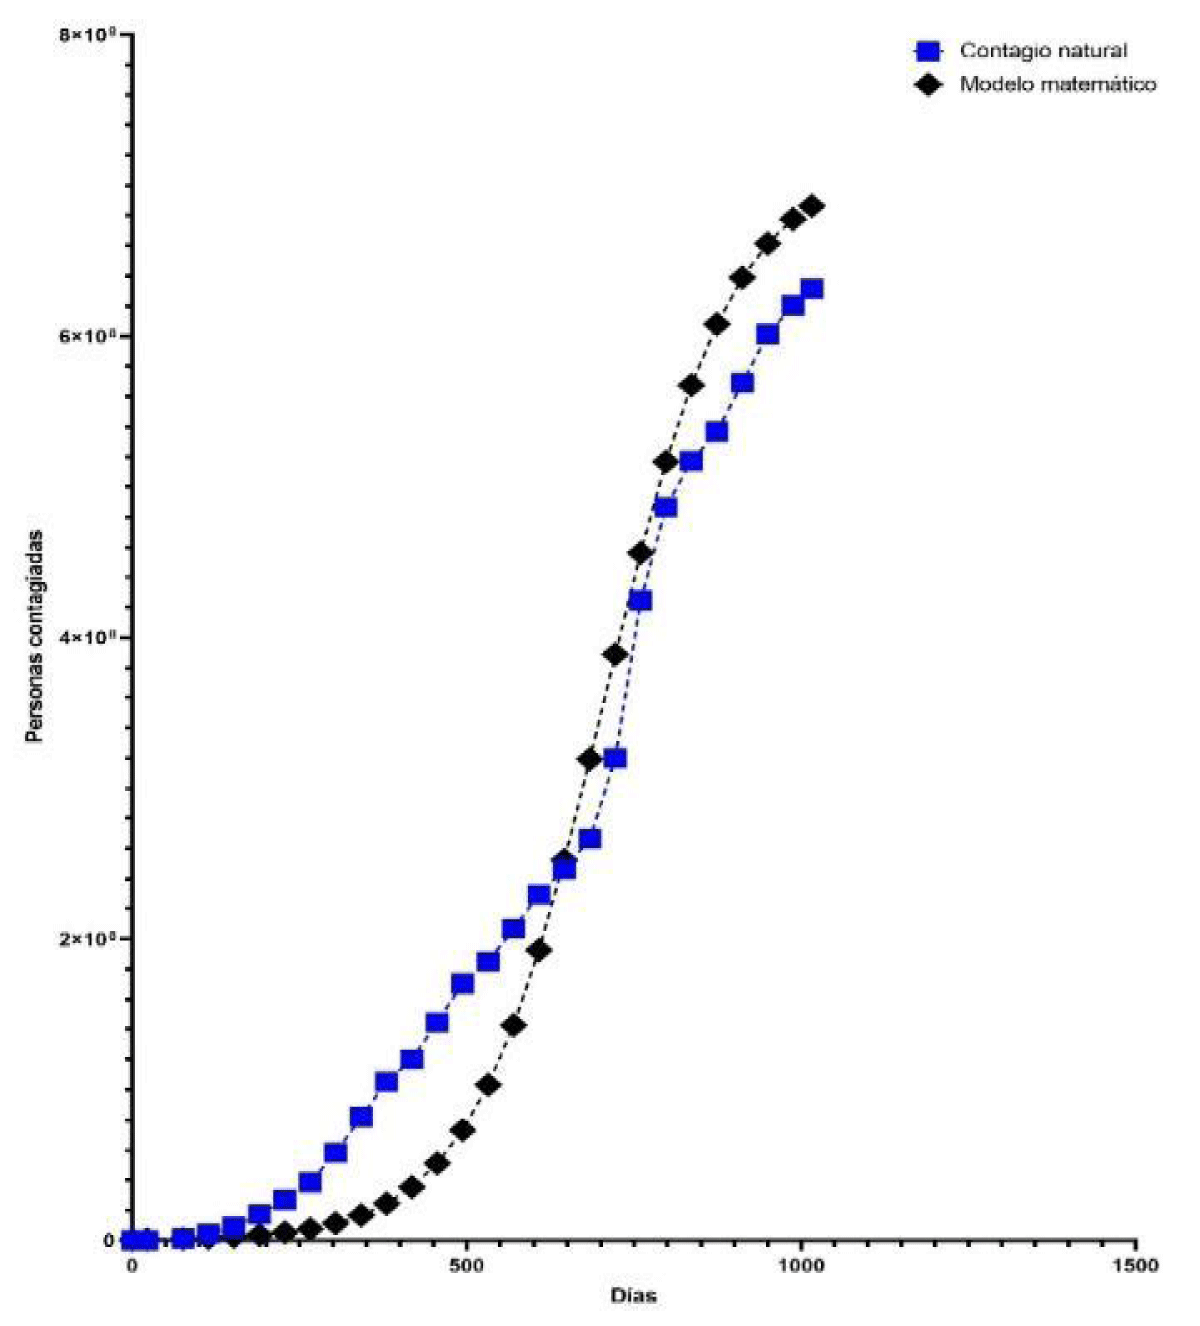
Figure 2: Graphic representation of the number of people infected and the estimated number of people infected by COVID-19, worldwide, based on the time elapsed (days).
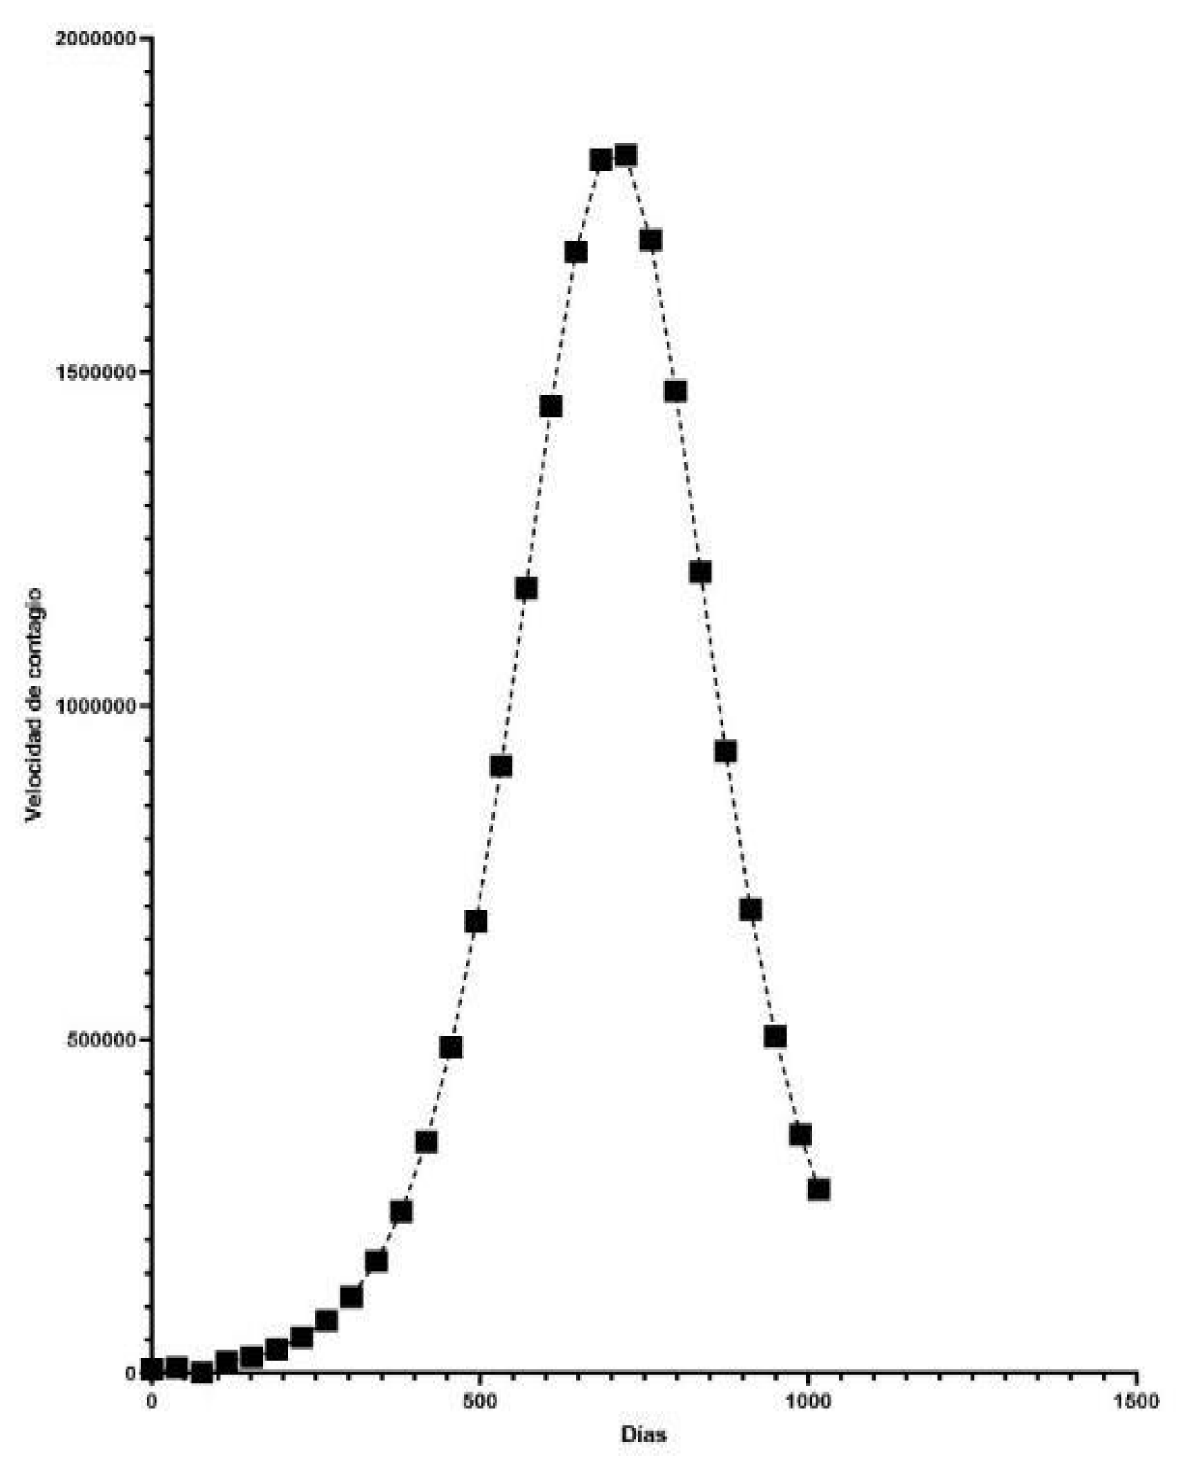
Figure 3: Representation of the speed of the estimated number of people infected (persons/day) COVID-19, worldwide, based on the elapsed time (days).
Test of significance of r. The Pearson correlation coefficient for the time elapsed t, (days) and the number of people infected (N), worldwide, by COVID-19, based on thirty-one cases, was r = -0.87764. This value of r represents a real relationship between the two variables; in which the standard error of r was calculated by expression (1).
Interpretation: Since tcal = 10,03 is greater thanttab = 1,71; it is concluded that the relationship between time, t (days), and the number of infections N (people) is real; therefore, there is a non-significant difference and that the model obtained (equation 2) has a high estimate of the correlated data. In addition, there is a "very strong correlation" between the time elapsed (t) and the number of infected people (N), while the coefficient of determination (r2 × 100) indica que el 77,03% of the variance in N is explained by t; for COVID-19 disease, worldwide.
The predictive logistic model (equation 6) to estimate the number of people infected by COVID-19 worldwide turned out to be quite acceptable, reaching a Pearson correlation coefficient of r = -0.88, coinciding with what was reported by Florencio [33]. The predictive logistic speed model (equation 7) predicts that the maximum number of people infected (people/day) by COVID-19 worldwide is 1694.7209 (people/day), whose scheduled date was January 24, 2022, coinciding with what was reported by Manrique-Abril, et al. [35] and Marín-Machuca, et al. [34]. In the predictive logistic model (equation 6), the proportionality constant and the correlation and determination coefficients are of great importance for analyzing and estimating data on epidemiological and pandemic phenomena; coinciding with what was mentioned by Hernández, et al. [39]. The critical time (tc), for infections worldwide, was adequately determined, a value established within what was theoretically reviewed and whose results are satisfactory in terms of forms, estimates, and quantities, like what was reported by Marín-Machuca, et al. [36].
The theory of Bronshtein & Semendiaev can be applied without difficulty if it is considered at what time the processes or phenomena manifest a behavior that will not always ascend or will not always descend. Logistic models can be applied as rigorously as possible to the pandemic and epidemiological phenomena with high resolution and a high degree of approximation to real data. The critical time (tc) for infections worldwide was seven hundred and thirty-three days, reaching its maximum estimated infection rate of 1694.7209 people/day. Statistically, it has been concluded that the correlation coefficient of equation (6) indicates that it has a "powerful negative correlation" between the number of estimated infections and the time elapsed (days) by COVID-19; worldwide.
In order to have a better prediction of the logistic model, it is recommended that the statistical data, in terms of the dependent variable, should be based on more independent variables; the independent variable data must be equally spaced to apply other techniques of calculation, analysis, and interpretation.
The maximum estimated number of possible infections was 713783211 people, which at the time of calculation turned out to be a horizontal asymptote. From the significance test of Person's r correlation coefficient, it is concluded that the relationship between time and the number of infections is real; Therefore, there is a non-significant difference, that the model obtained has a high estimate of the correlated data, there being a “very strong correlation” between the time elapsed (t) and the number of infected people (N), while the coefficient determination (r2×100) indicates that 77.03% of the variance in N is explained by t; for the COVID-19 disease, worldwide.
- Chen G, Zhang W, Li S, Zhang Y, Williams G, Huxley R, Ren H, Cao W, Guo Y. The impact of ambient fine particles on influenza transmission and the modification effects of temperature in China: A multi-city study. Environ Int. 2017 Jan;98:82-88. doi: 10.1016/j.envint.2016.10.004. Epub 2016 Oct 11. PMID: 27745688; PMCID: PMC7112570.
- Tellier R, Li Y, Cowling BJ, Tang JW. Recognition of aerosol transmission of infectious agents: a commentary. BMC Infect Dis. 2019 Jan 31;19(1):101. doi: 10.1186/s12879-019-3707-y. PMID: 30704406; PMCID: PMC6357359.
- Liu XX, Li Y, Qin G, Zhu Y, Li X, Zhang J, Zhao K, Hu M, Wang XL, Zheng X. Effects of air pollutants on occurrences of influenza-like illness and laboratory-confirmed influenza in Hefei, China. Int J Biometeorol. 2019 Jan;63(1):51-60. doi: 10.1007/s00484-018-1633-0. Epub 2018 Oct 31. PMID: 30382350.
- Shereen MA, Khan S, Kazmi A, Bashir N, Siddique R. COVID-19 infection: Origin, transmission, and characteristics of human coronaviruses. J Adv Res. 2020 Mar 16;24:91-98. doi: 10.1016/j.jare.2020.03.005. PMID: 32257431; PMCID: PMC7113610.
- Revollé A. Coronavirus in Peru: This is how the pandemic evolves in the country. The Republic newspaper. 2020.
- Levison E. Early transmission dynamics in Wuhan, China. Medicine from Drexel University School of Medicine. 2020.
- Zhou P, Yang XL, Wang XG, Hu B, Zhang L, Zhang W, Si HR, Zhu Y, Li B, Huang CL, Chen HD, Chen J, Luo Y, Guo H, Jiang RD, Liu MQ, Chen Y, Shen XR, Wang X, Zheng XS, Zhao K, Chen QJ, Deng F, Liu LL, Yan B, Zhan FX, Wang YY, Xiao GF, Shi ZL. A pneumonia outbreak associated with a new coronavirus of probable bat origin. Nature. 2020 Mar;579(7798):270-273. doi: 10.1038/s41586-020-2012-7. Epub 2020 Feb 3. Erratum in: Nature. 2020 Dec;588(7836):E6. PMID: 32015507; PMCID: PMC7095418.
- Mizumoto K, Chowell G. Estimating Risk for Death from Coronavirus Disease, China, January-February 2020. Emerg Infect Dis. 2020 Jun;26(6):1251-1256. doi: 10.3201/eid2606.200233. Epub 2020 Jun 17. PMID: 32168464; PMCID: PMC7258458.
- Bravo A, Valera M. SARS-CoV-2 and Pandemic acute respiratory syndrome (COVID-19). Ars Pharmaceutica. 2020; 61(2): 63-79.
- Ahmed SF, Quadeer AA, McKay MR. Preliminary Identification of Potential Vaccine Targets for the COVID-19 Coronavirus (SARS-CoV-2) Based on SARS-CoV Immunological Studies. Viruses. 2020 Feb 25;12(3):254. doi: 10.3390/v12030254. PMID: 32106567; PMCID: PMC7150947.
- Guo YR, Cao QD, Hong ZS, Tan YY, Chen SD, Jin HJ, Tan KS, Wang DY, Yan Y. The origin, transmission and clinical therapies on coronavirus disease 2019 (COVID-19) outbreak - an update on the status. Mil Med Res. 2020 Mar 13;7(1):11. doi: 10.1186/s40779-020-00240-0. PMID: 32169119; PMCID: PMC7068984.
- Coronaviridae Study Group of the International Committee on Taxonomy of Viruses. The species Severe acute respiratory syndrome-related coronavirus: classifying 2019-nCoV and naming it SARS-CoV-2. Nat Microbiol. 2020 Apr;5(4):536-544. doi: 10.1038/s41564-020-0695-z. Epub 2020 Mar 2. PMID: 32123347; PMCID: PMC7095448.
- Van Doremalen N, Bushmaker T, Morris DH, Holbrook MG, Gamble A, Williamson BN, Tamin A, Harcourt JL, Thornburg NJ, Gerber SI, Lloyd-Smith JO, de Wit E, Munster VJ. Aerosol and Surface Stability of SARS-CoV-2 as Compared with SARS-CoV-1. N Engl J Med. 2020 Apr 16;382(16):1564-1567. doi: 10.1056/NEJMc2004973. Epub 2020 Mar 17. PMID: 32182409; PMCID: PMC7121658.
- Wang LF, Cowled C. Bats and viruses: a new frontier of emerging infectious diseases. 1sted. Hoboken: Wiley-Blackwell. 2015.
- Guan WJ, Ni ZY, Hu Y, Liang WH, Ou CQ, He JX, Liu L, Shan H, Lei CL, Hui DSC, Du B, Li LJ, Zeng G, Yuen KY, Chen RC, Tang CL, Wang T, Chen PY, Xiang J, Li SY, Wang JL, Liang ZJ, Peng YX, Wei L, Liu Y, Hu YH, Peng P, Wang JM, Liu JY, Chen Z, Li G, Zheng ZJ, Qiu SQ, Luo J, Ye CJ, Zhu SY, Zhong NS; China Medical Treatment Expert Group for Covid-19. Clinical Characteristics of Coronavirus Disease 2019 in China. N Engl J Med. 2020 Apr 30;382(18):1708-1720. doi: 10.1056/NEJMoa2002032. Epub 2020 Feb 28. PMID: 32109013; PMCID: PMC7092819.
- Yang X, Yu Y, Xu J, Shu H, Xia J, Liu H, Wu Y, Zhang L, Yu Z, Fang M, Yu T, Wang Y, Pan S, Zou X, Yuan S, Shang Y. Clinical course and outcomes of critically ill patients with SARS-CoV-2 pneumonia in Wuhan, China: a single-centered, retrospective, observational study. The Lancet. Respiratory medicine. 2020; 8(5): 475-481. https://doi.org/10.1016/S2213-2600(20)30079-5
- World Health Organization. Report of the WHO-China Joint Mission on Coronavirus Disease 2019 (COVID-19). 2020.
- Zhang W, Liu S, Osgood N, Zhu H, Qian Y, Jia P. Using simulation modelling and systems science to help contain COVID-19: A systematic review. Syst Res Behav Sci. 2022 Aug 19:10.1002/sres.2897. doi: 10.1002/sres.2897. Epub ahead of print. PMID: 36245570; PMCID: PMC9538520.
- Joshi H, Jha BK, Yavuz M. Modelling and analysis of fractional-order vaccination model for control of COVID-19 outbreak using real data. Math Biosci Eng. 2023 Jan;20(1):213-240. doi: 10.3934/mbe.2023010. Epub 2022 Sep 30. PMID: 36650763.
- Arora P, Kumar H, Panigrahi BK. Prediction and analysis of COVID-19 positive cases using deep learning models: A descriptive case study of India. Chaos Solitons Fractals. 2020 Oct;139:110017. doi: 10.1016/j.chaos.2020.110017. Epub 2020 Jun 17. PMID: 32572310; PMCID: PMC7298499.
- Chanchí G, Gómez A, Hernández-Londoño Cl. IoT system for monitoring and analysis of saturation level and heart rate in the early diagnosis of Covid-19. Ibérica Magazine of Information Systems and Technologies, E42. 2021; 272-285.
- Orosco J, Huamaní N. Forecasting the number of confirmed cases and deaths from COVID-19 using the logistic growth model in South American countries. Iberian Journal of Information Systems and Technologies, E40. 2021; 330-338.
- Mude W, Oguoma VM, Nyanhanda T, Mwanri L, Njue C. Racial disparities in COVID-19 pandemic cases, hospitalisations, and deaths: A systematic review and meta-analysis. J Glob Health. 2021 Jun 26;11:05015. doi: 10.7189/jogh.11.05015. PMID: 34221360; PMCID: PMC8248751.
- Msemburi W, Karlinsky A, Knutson V, Aleshin-Guendel S, Chatterji S, Wakefield J. The WHO estimates of excess mortality associated with the COVID-19 pandemic. Nature. 2023 Jan;613(7942):130-137. doi: 10.1038/s41586-022-05522-2. Epub 2022 Dec 14. PMID: 36517599; PMCID: PMC9812776.
- Wang P, Zheng X, Li J, Zhu B. Prediction of epidemic trends in COVID-19 with logistic model and machine learning technics. Chaos Solitons Fractals. 2020 Oct;139:110058. doi: 10.1016/j.chaos.2020.110058. Epub 2020 Jul 1. PMID: 32834611; PMCID: PMC7328553.
- Carvalho T. COVID-19 Research in Brief: 4 April to 10 April, 2020. Nat Med. 2020 Apr 10. doi: 10.1038/d41591-020-00009-x. Epub ahead of print. PMID: 32286558.
- Vargas C, Acosta R, Bernilla A. El nuevo coronavirus y la pandemia del COVID-19. Revista Médica Herediana. 2020; 31(2): 125-131. https://doi.org/10.20453/rmh.v31i2.3776
- CDC CpeCylPdE. Mpox. 2022. https://www.cdc.gov/poxvirus/monkeypox/index.html.
- Bunge EM, Hoet B, Chen L, Lienert F, Weidenthaler H, Baer LR, Steffen R. The changing epidemiology of human monkeypox-A potential threat? A systematic review. PLoS Negl Trop Dis. 2022 Feb 11;16(2):e0010141. doi: 10.1371/journal.pntd.0010141. PMID: 35148313; PMCID: PMC8870502.
- Fan Y, Zhao K, Shi ZL, Zhou P. Bat Coronaviruses in China. Viruses. 2019 Mar 2;11(3):210. doi: 10.3390/v11030210. PMID: 30832341; PMCID: PMC6466186.
- WHO OMdlS. Monkeypox. 2022. https://www.who.int/news-room/fact sheets/detail/monkeypox.
- Thanh Le T, Andreadakis Z, Kumar A, Gómez Román R, Tollefsen S, Saville M, Mayhew S. The COVID-19 vaccine development landscape. Nat Rev Drug Discov. 2020 May;19(5):305-306. doi: 10.1038/d41573-020-00073-5. PMID: 32273591.
- Florencio CF. Statistical calculations on a closed SIR model extrapolating data from the current Coronavirus outbreak to a scenario of the Mexican population, Mayor Magdalena Contreras. CDMX Public Health Services. Mexico. 2020.
- Marín-Machuca O, Zambrano-Cabanillas AW, García-Talledo EG, Ortiz-Guizado JI, Rivas-Ruiz DE, Marín-Sánchez O. Mathematical modeling of the epidemiological behavior of the COVID-19 pandemic in China. The Biologist. 2020; 18(1).
- Manrique-Abril FG, Agudelo-Calderon CA, González-Chordá VM, Gutiérrez-Lesmes O, Téllez-Piñerez CF, Herrera-Amaya G. Modelo SIR de la pandemia de COVID-19 en Colombia [SIR model of the COVID-19 pandemic in Colombia]. Rev Salud Publica (Bogota). 2020 Mar 1;22(2):123-131. Spanish. doi: 10.15446/rsap.V22n2.85977. PMID: 36753100.
- Marín-Machuca O, Chacón RD, Alvarez-Lovera N, Pesantes-Grados P, Pérez-Timaná L, Marín-Sánchez O. Mathematical Modeling of COVID-19 Cases and Deaths and the Impact of Vaccinations during Three Years of the Pandemic in Peru. Vaccines (Basel). 2023 Oct 27;11(11):1648. doi: 10.3390/vaccines11111648. PMID: 38005980; PMCID: PMC10674587.
- National Computer System of Deaths (SINADEF). Information on deceased persons from the National Death System in the Ministry of Health. 2022. https://www.minsa.gob.pe/defunciones/
- Bronshtein I, Semendiaev K. Mathematical Handbook for Engineers and Students. 4th Edition. Mir Publishing House. Moscow. USSR. 2018.
- Hernandez-Sampieri R, Fernandez-Collado C, Baptista-Lucio MP. Research methodology. McGraw-Hill Publishing Inter-American Publishers, S.A. of C.V. C.P. 01376, Mexico D.F. 2014.
- State of Health. COVID-19: Cumulative number of cases in the world 2020-2022. 2023. https://es.statista.com/estadisticas/1104227/numero-acumulado-de-casos-de coronavirus-covid-19-en-el-mundo-enero-marzo/