
More Information
Submitted: April 21, 2025 | Approved: May 22, 2025 | Published: May 23, 2025
How to cite this article: Bachmann RM. White Paper Energy Resilience for the European Union. Int J Phys Res Appl. 2025; 8(5): 120-144. Available from:
https://dx.doi.org/10.29328/journal.ijpra.1001121
DOI: 10.29328/journal.ijpra.1001121
Copyright license: © 2025 Bachmann RM. This is an open access article distributed under the Creative Commons Attribution License, which permits unrestricted use, distribution, and reproduction in any medium, provided the original work is properly cited.

White Paper Energy Resilience for the European Union
Rainer M Bachmann*
A Master's Degree in Physics from the University RWTH Aachen, Germany
*Address for Correspondence: Rainer M Bachmann, A Master's Degree in Physics from the University RWTH Aachen, Germany, Email: [email protected]
Preamble
The Energy Trilemma: this conflict of interests addresses three fundamental challenges. Those emanating from economics (affordability), politics (energy security or security of energy supply) and the environment (including climate change and sustainability). The predicament is the clash between the rising global energy demand and the need to radically reduce CO2 emissions - this has led to increased integration of more sustainable (renewable) energy sources in global energy systems.
So the priorities have been shifted from affordability to a radical focus on renewable energy production. The Russian aggression against Ukraine demonstrates for the EU the importance of the 2nd objective (energy security or security of energy supply).
In the following we want to address a more balanced approach through application of a variety of new and efficient technologies.
- Technologies and its progress shall make EU energy resilient.
- The affordability shall be granted through a stronger cooperation power generation within EU. Production where it is most efficient, e.g. solar preferably in the south and wind farms in coastal or wind rich areas plus Energy intensive industry developments near power generation.
- Security of supplies through smart energy infrastructure as a reasonable and realistic time frame for the phase out of fossil fuels (Gas storage and transport infrastructure shall be used wherever possible)
The European Union is depending on energy provision from different countries, among others from Russia. Since Russia proved to be aggressive and unreliable, the EU has to change to generating its own energy, get independent of external sources and getting rid of any fossil energy. This is the background of a white paper, which will show that
- Energy resilience of the EU can be achieved
- Climate neutrality is possible until 2045
- The results of the transition can be used to transfer the related technology to interested countries.
The authors of this document are (full name and relevant energy background)
− Andreas B. Otte - Entrepreneur, Consultant and Project Developer, Founder EURECI Project, works since 1990 in renewable energy and power plant sector
− Bahman Hamedebarghi – Physicist and Managing Director of NE3T GmbH (Nexus of Energy Efficiency and Environment Technologies)
− Oliver Schulte, former CFO of RWE Italy, which had a focus on wind farms in Italy
− Rainer Bachmann - Physicist and CEO of E:E Consulting plus member of the EU Senate for Technology
− Thomas Kleefuß, former CEO of RWE Net4Gas s.r.o., in Prag and then CEO of STORAG Etzel GmbH, Europe’s largest independent oil & gas storage operator
Primary Energy Requirements of the EU
Presently the EU is depending on fossil energy provided by different countries. The energy consists on fossil energy like natural gas, oil, black coal and lignite.
According to the Agenda2050 of the EU these fossil fuels have to be replaced with Renewable Energy Sources (RES). The RES will have to be used in the “sector coupling” to substitute energy for the industry processes, mobility and heating: these today are based on fossil energy sources.
The actual amounts of energy being imported from the mentioned countries are listed below (Figures 1,2).
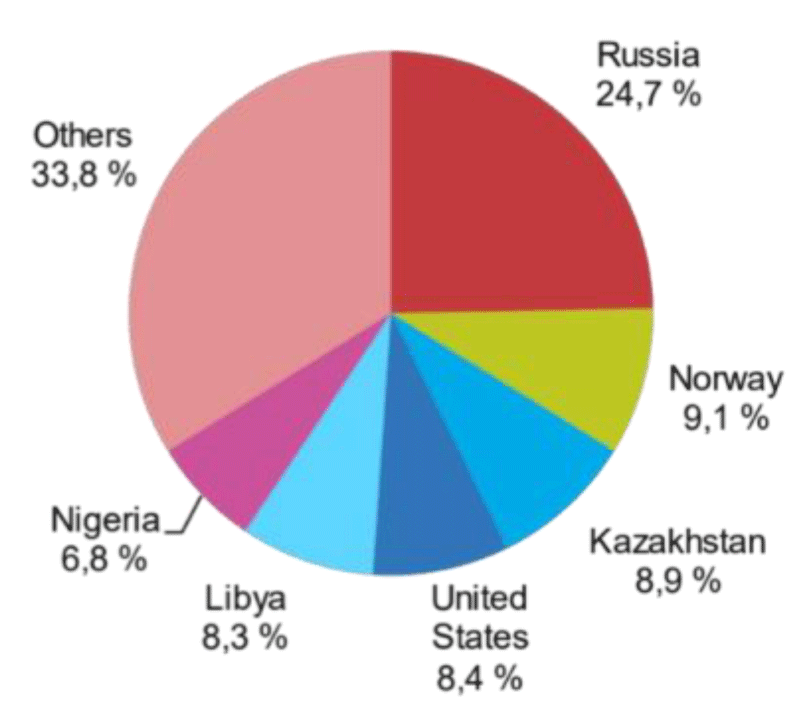
Figure 1: Percentages - distribution of fossil energy imports to the EU. Source: eurostat https://ec.europa.eu/eurostat/statistics-explained/index.php? title=File:Extra_EU_imports_of_petroleum_oil_from_main_trading_partners,_2020_and_first_sem ester_2021.png
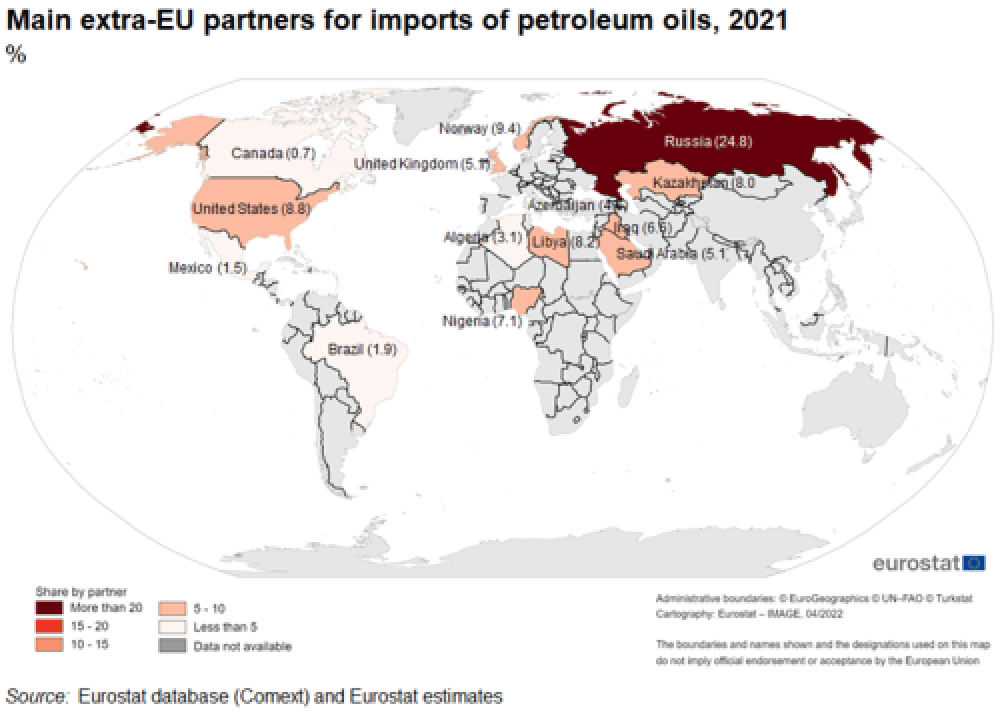
Figure 2: Map of countries providing fossil energy to the EU. Source: Eurostat https://ec.europa.eu/eurostat/statistics-explained/images/thumb/b/b1/Petroleum_oil%2C_main_partners%2C_2021.png/500px-Petroleum_oil%2C_main_partners%2C_2021.png
Energy sectors
The primary energy imported is being utilized for several sectors. Electricity is not imported in relevant amounts, since the generation plants are still active all over Europe and are fed with fossil fuels or with fuel elements for nuclear power plants.
Only a part of the generation of electricity is based on RES like photo voltaic and wind farms. Imports of electrical energy to the EU are coming from Norway to Sweden and Denmark and from Tunisia to Italy.
The distribution of the primary energy consumption e.g. for Germany is listed below (Figure 3).
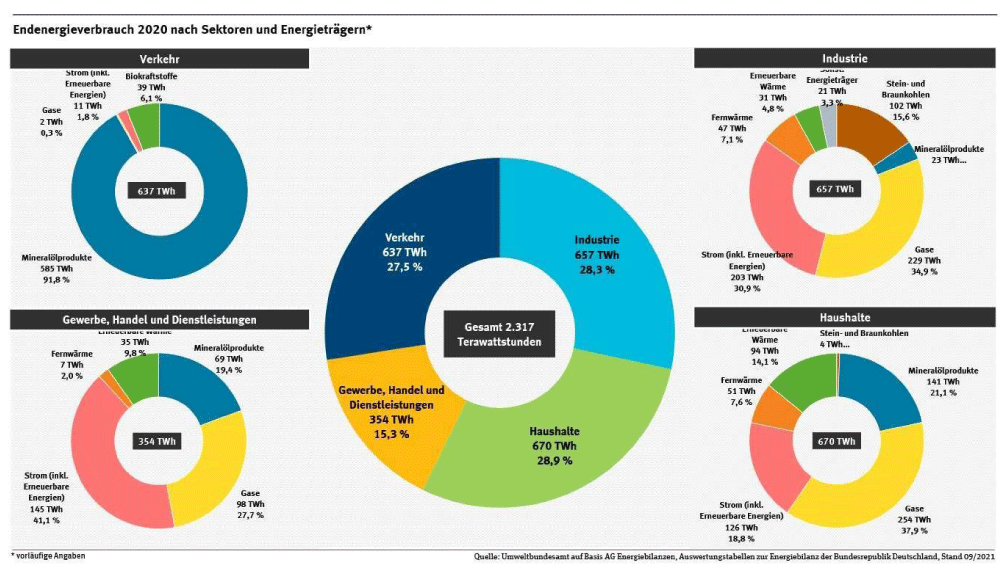
Figure 3: Distribution of primary energy consumption in Germany. Source: Umweltbundesamt.de https://www.umweltbundesamt.de/sites/default/files/medien/384/bilder/4_abb_eev-sektorenet_2022-03-25.png
Types and generation potential of actual generation facilities
The amounts and sources of the energy generation are displayed below. The vast majority of energy is based on fossil fuels. Energy efficiency measures have to be planned to reduce the amounts of energy consumed.
CO2 footprint within the EU and worldwide (Figures 4,5)
Figure 4: CO2 footprint of the EU countries (Source: https://www.worldometers.info/CO2emissions/CO2-emissions-per-capita/) [1].
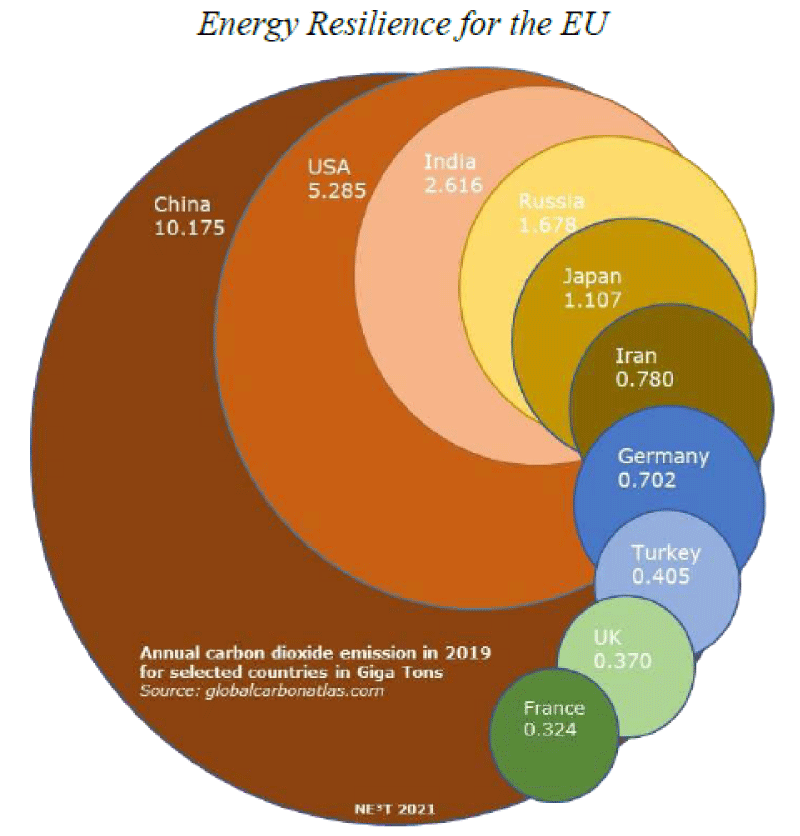
Figure 5: The most relevant CO2 producers in the world. Source: NE3T GmbH; Data from Global Carbon Atlas http://www.globalcarbonatlas.org/en/CO2-emissions
Although Germany has invested more in solar and wind projects than any other European country, its CO2 emissions are still among the highest in the world. The top ten of the biggest European climate sinners consist entirely of lignite and coal-fired power plants and district heating in Germany and Poland.
Though The Netherlands: natural gas and Czech Republic: natural gas and coal have an even worse CO2 footprint, the population is not big in relation to Germany and Poland.
In absolute figures Germany as an industrialized country is among the 10 biggest producers of CO2.
Remark: Methane from industrial livestock farming is even worse for the climate than CO2 and has to be considered by the EU.
Nuclear Power Plants (NPP)
A part of the electricity is generated in Nuclear Power Plants (NPP). The implementation of more NPPs is not sustainable, however the existing NPPs should stay connected to the grids as long as they produce electricity. In Germany in the last 18 months 6 active NPPs have been disconnected from the grid - that should be reconsidered.
With an average generation power of 1 GW the 6 NPPs could generate up to 60 TWh / year and thus provide 10% of the actual required electricity.
In comparison re-starting blocks of lignite power plants is climate wise a disaster (Figure 6).
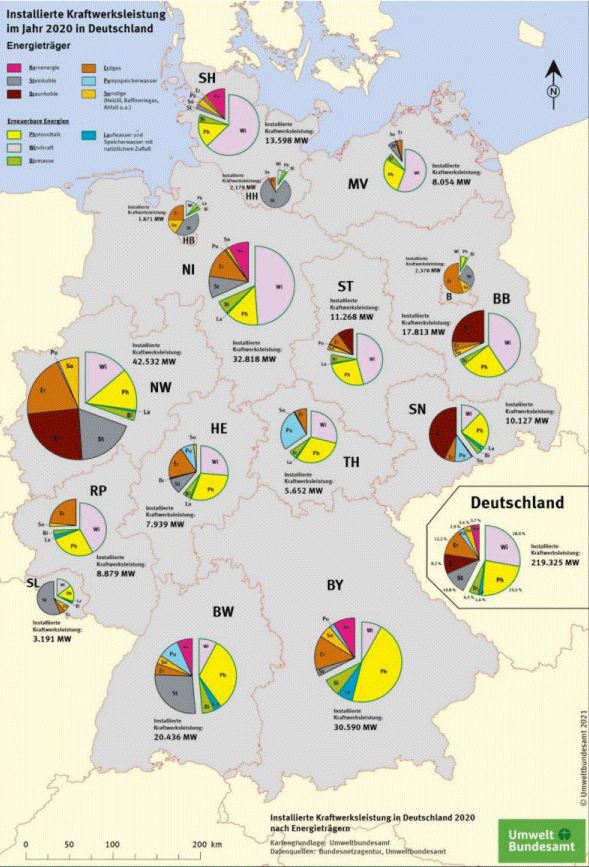
Figure 6: Distribution of power plant capacity and sources in Germany. Source: Umweltbundesamt.de, https://www.umweltbundesamt.de/sites/default/files/medien/372/bilder/ kraftwerksleistung_2021.png
The electricity in Germany is generated in the 3 top industrial areas: North Rhine Westphalia (NW). Lower Saxony (NI) and Bavaria (BY). The percentage of fossil energy is especially high in NW, since still lignite and black coal fired power plants are in operation here. These have to be shut down as soon as possible.
Expected reduction of primary energy requirement - improved energy efficiency
Heating and cooling in real estate areas: Energy efficiency is a key factor for a sustainable and resilient energy transition. Every kilowatt hour, which we do not consume, doesn't have to be generated and thus it is the cheapest and cleanest form of energy. In addition, energy efficiency in the buildings, in cities, transportation, agriculture, industries, etc. makes our cities more habitable and generates thousands of meaningful jobs.
- Some measures to improve the efficiency of the energy consumption in the buildings
A major part of the energy in the buildings is used for heating and cooling (Figure 7).
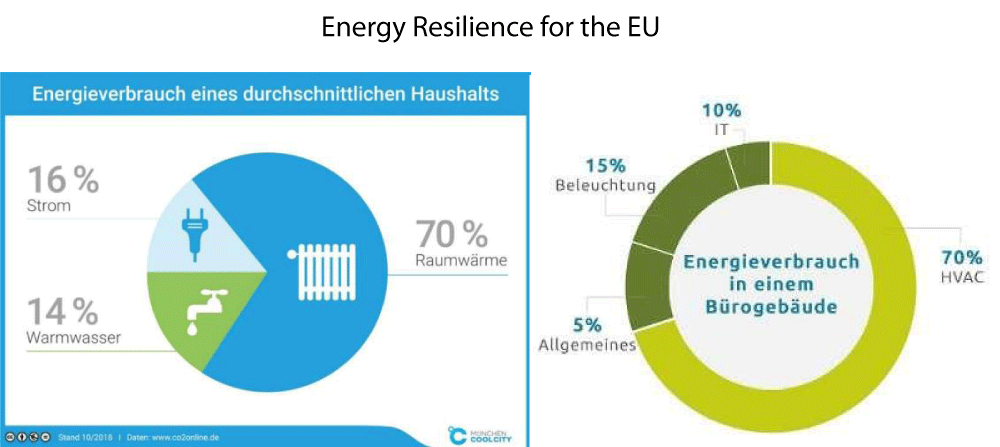
Figure 7: a, Energy consumption in commercial buildings. 7a: Source: München Cool City https://coolcity.de/wp-content/uploads/Energieverbrauch-Infografik.png, 7b) Source: Sprinx Deutschland GmbH https://sprinxinternational.com/userfiles/SEE/SEEgraph_EnergieverbruikKantoorpand70_RGB_DE_610x381.jpg
Meanwhile there are IT solutions in place which allow the forecast of an electricity generation based on the utilization of Combined Heat and Power Plants (CHP) by managing the thermal reservoir in an appropriate way. This solution should be extended to the thermal reservoirs of solar thermal power plants.
A very important point is improving the energy efficiency of the buildings by insulation or building with high standards. Good insulation can reduce energy needs by up to 75% and a passive house can bring up to 2500% less heat and cooling requirements than an old house.
Implementing heat pumps can also bring saving on heating and cooling energy up to 400%. The best category is A+ = high efficiency standard, the lowest is H = no upgrade on efficiency (Figures 8,9).
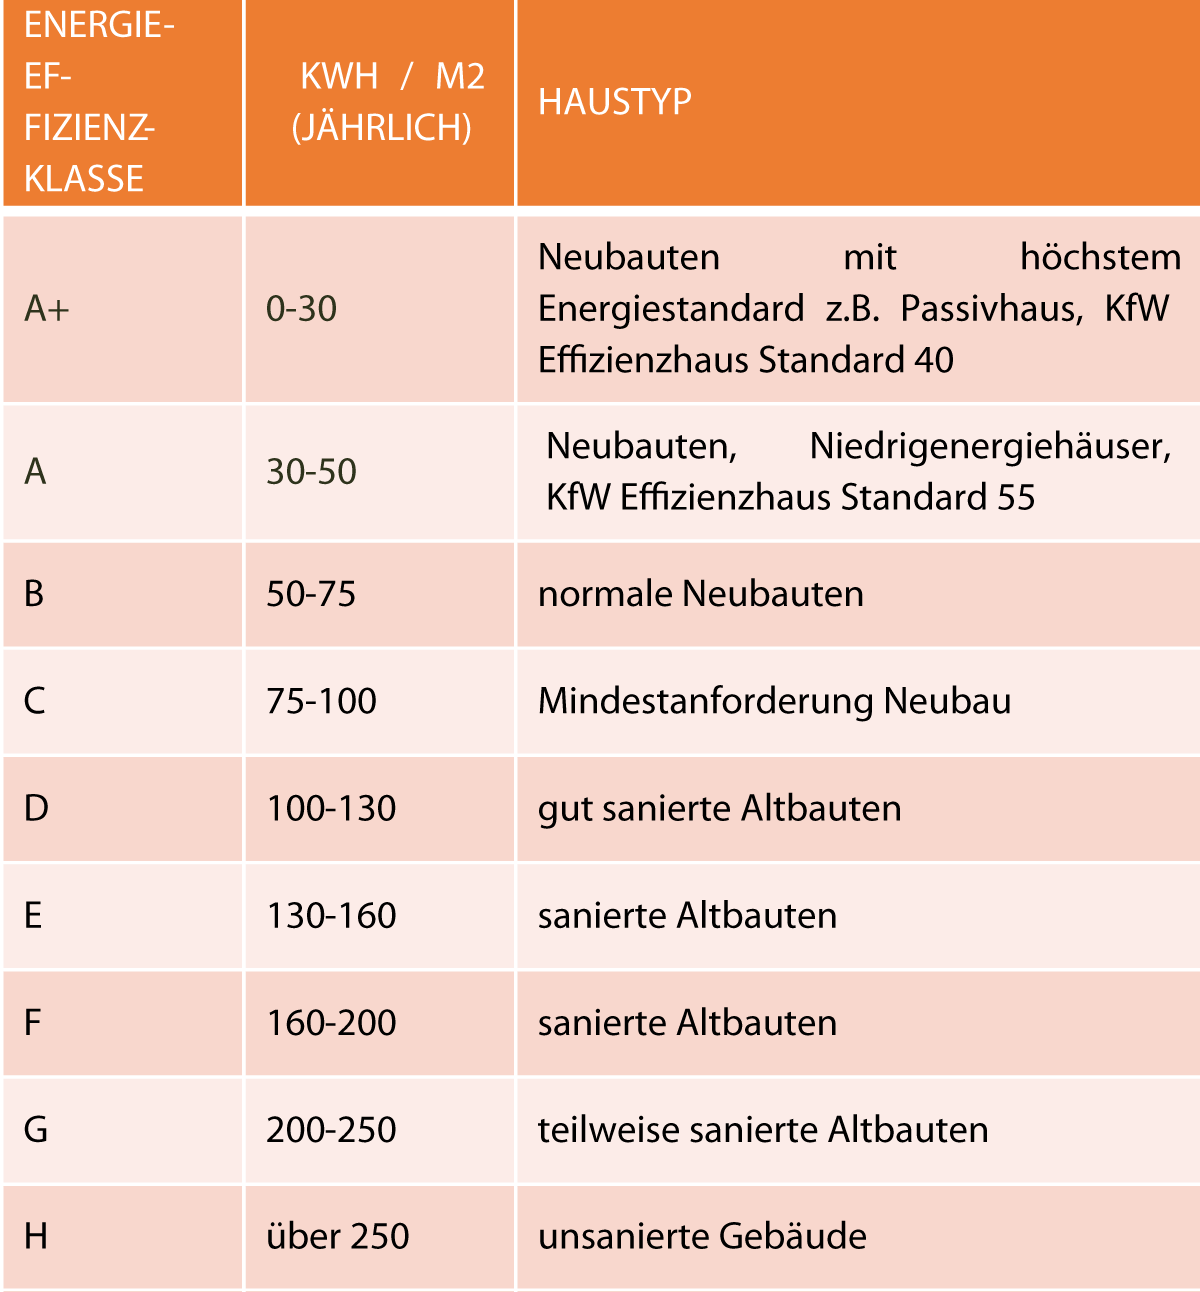
Figure 8: Figure energy efficiency classes. Source: Wegatech; Data from Bundesanzeiger https://www.wegatech.de/ratgeber/energieeffizienzklasse-haus/
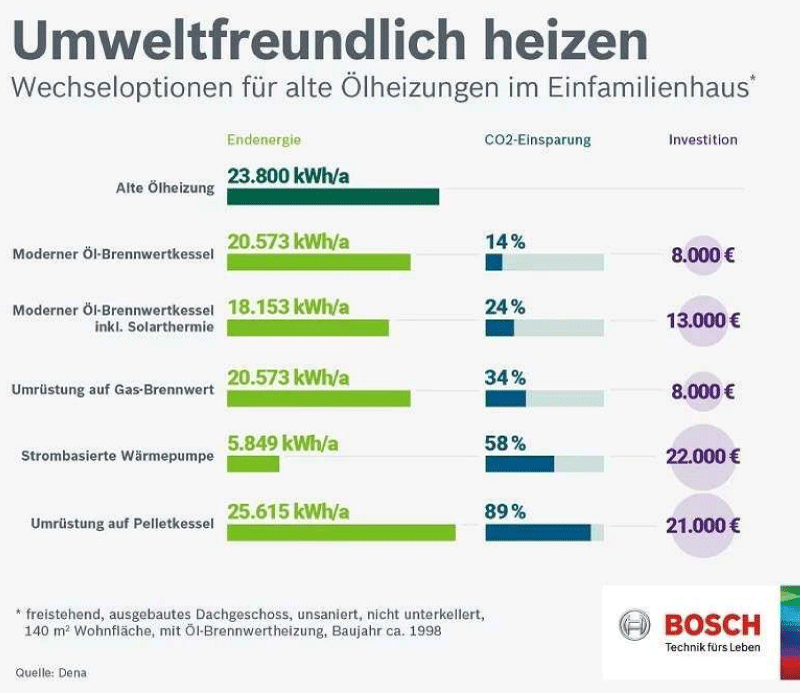
Figure 9: Efficiency of heating devices. Source: Dena https://www.effizienzhaus-online.de/wp-content/uploads/u/m/umweltfreundlich-heizen-oelheizungwechseloptionen.jpg
Additionally, a roof top PV plus a storage system can be used to generate part of the required electricity.
Remark: “pelletkessel” burn pellets from wood, this cannot be regarded as been climate neutral.
- Some measures to improve the efficiency of the energy consumption in the industry
The industry is consuming a large part of the total primary energy and is also producing a large part of the emissions. Apart of using smart and efficient lightning, heating and cooling solutions, there are a number of additional measures, which can be taken by the industry.
Using Geo thermic solutions for process heat
Heat pumps and geothermic solutions are extremely efficient, sustainable, clean and have high availability and can cover a large part of the process heating requirements of the industry. Very high power and heating can be generated by deep drilling = deeper than 3-5 km (Figure 10).
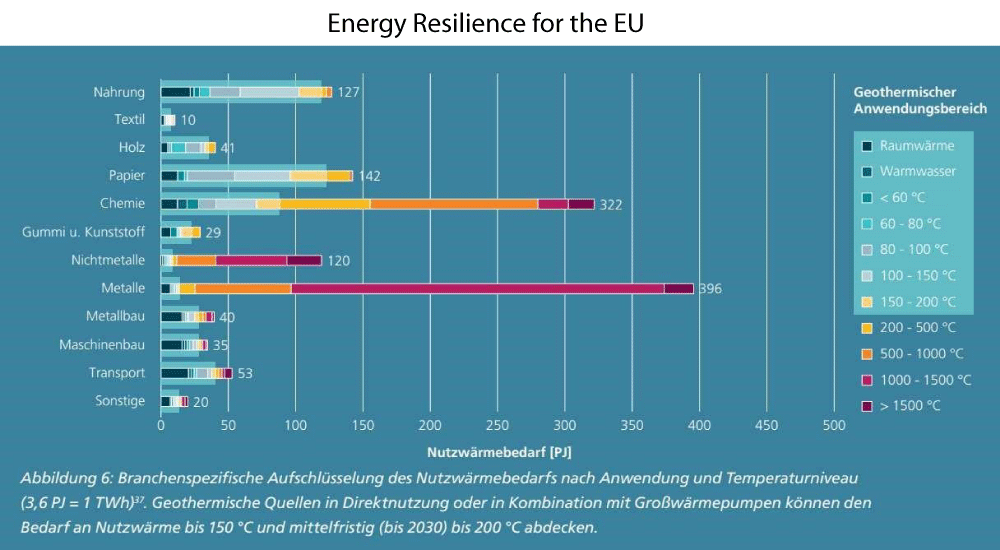
Figure 10: Requirements for process heating per industry segment. Source: Bundesverband Geothermie https://www.geothermie.de/fileadmin/_processed_/a/e/csm_Prozesswaerme2_e8a73278af.png
Several industry sectors require relevant process heats, e.g. steel, chemicals, paper, concrete etc (Figure 11).
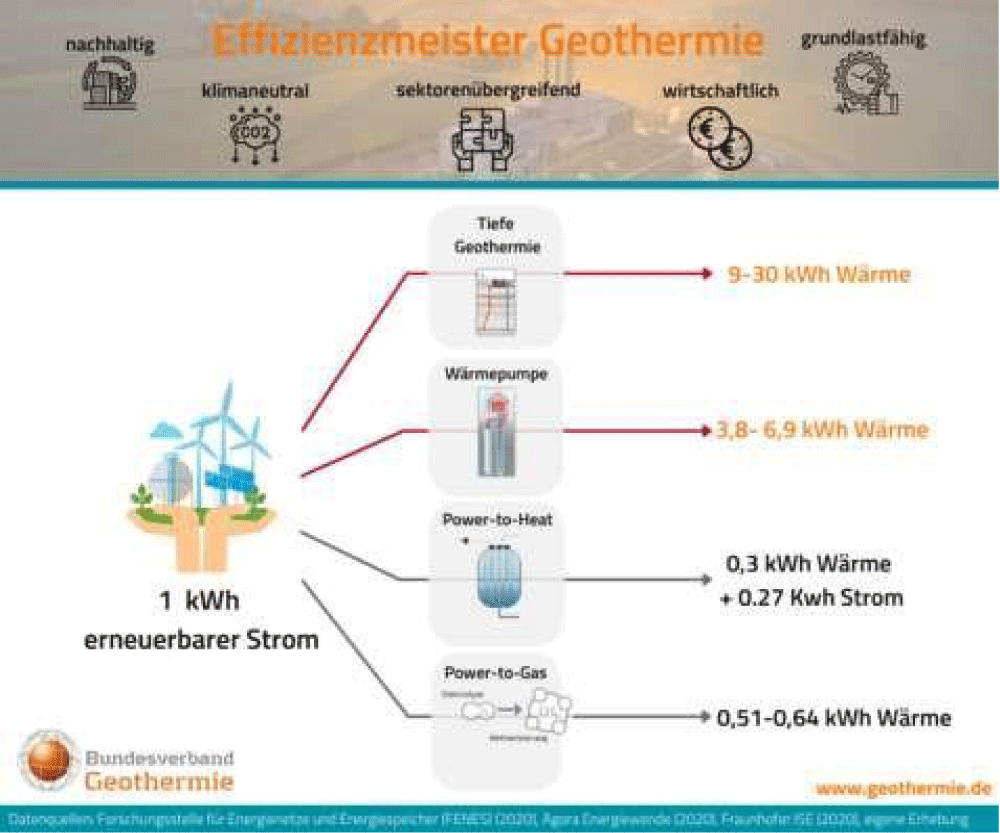
Figure 11: Geothermal efficiency. Source: Bundesverband Geothermie https://www.geothermie.de/fileadmin/_processed_/7/e/ csm_Klimaneutrale_Waerme_Auszug_20220201_Sektorenkopplung_CMYK_39c8ae03c0.jpg
Efficient drive technology and electric motors
The electric motors and systems are the largest single-energy end-users and account for more than 40% of global electricity consumption. (https://www.iea.org/reports/energy-efficiency-policyopportunities-for-electric-motor-driven-systems)
Enormous savings potential can be tapped simply by using variable-speed drives, e. g. the use of a converter. An optimal ratio between load and energy consumption should be aimed at. According to the VDI, this can lead to savings of 50% to 70%, especially for pumps.
IE5 synchronous reluctance motors: Synchronous reluctance motors meet IE5 energy efficiency requirements. Compared to IE2 motors, they have up to 50% lower energy losses. Practice has shown that energy consumption can be reduced by up to 25%, depending on the application.
Efficient robots
Depending on the application, energy savings of up to 30% can be achieved with handling robots by temporarily storing and recycling energy.
Efficient air compressors
The hotter the world gets and the wealthier the developing world get, the more air conditioners will come online. According to the IEA, fans and air conditioners already account for 10 percent of the world's electricity consumption, but as billions of households in hot areas install air conditioning, this demand for electricity will skyrocket.
Very efficient air compressors deliver 90 percent more pressure than the average air compressor with the same power consumption (https://www.magtor.tech/)
Efficient transport, mobility, logistics
In transport, mobility and logistics there is a huge potential to reduce the energy consumption. Combustion engines have an efficiency of below 30% while electric motors have an efficiency of close to 100%. The move from ICE to e-mobility will thus reduce the energy consumption to one third or less (Figure 12).
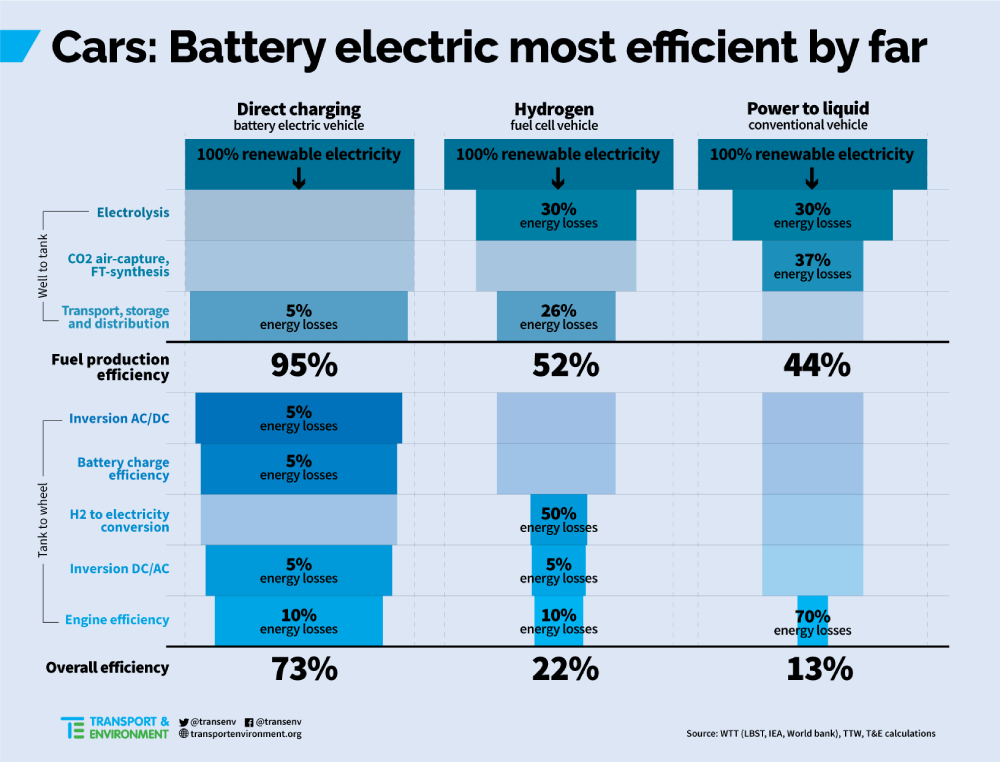
Figure 12: Efficiency of car propulsion systems. Source: Cleantechnica from Transport & Environment https://cleantechnica.com/files/2020/06/most-efficient-automobiles.png?mrf-size=m
An open issue is the range and if e-busses and e-trucks will be able to transport enough energy for long haul transports. On the logistics sector the drivers have to do a rest every 4,5 hours for 45 minutes: that should be sufficient to recharge the batteries but will require megawatt charging devices, which are available already.
Use of smart methods in the transportation - better sharing offers, more efficient delivery of goods, increasing the minimum occupancy rate for private and public, avoiding traffic jams - are important measures to increase the efficiency in the transportation sector. An upgrade of the public transport system especially in rural areas and extension of railways is strongly recommended.
A free but traceable shared bicycle or e-bike service for all citizens in the cities could also reduce the amount of car traffic and reduce the energy consumption as well.
Target scenario
The generation will have to be based on
- Wind onshore and offshore plus P2X conversion
- Photovoltaic
- Solar thermal
- Geo thermal
- Nuclear power plants
Wind onshore and offshore plus P2X conversion
Wind onshore will provide regional electrical power. For that the transport system has to be upgraded, since the major wind parks are typically connected to the high voltage or to the highest voltage and the energy has to be transported to different areas of Europe.
The same requirement to upgrade the transport system has applied to offshore wind parks. The maritime ecology is being affected by these farms, thus the solution that has been developed in Denmark can be preferred: artificial islands are used to install wind parks in the sea and there is one major connection to the coast.
The wind energy is variable, an alternative to forwarding the electricity all over Europe is to generate hydrogen and store in the available gas storage. Thus the energy is being converted with electrolysers (P2G) and can be reverted into electricity when requested with burning the hydrogen. The efficiency of the electrolysers has lately reached 75% (WESTNETZ, Germany).
The hydrogen will be transported via the existing pipelines – though the connecting steel pipelines and pressure stations have to be upgraded as well – to wherever it is needed. Some industries like steel, cement, glass, chemical, paper will directly utilize hydrogen to replace fossil fuels.
Whenever the regional demand is lower than the generated electrical energy, the electricity will be used to operate electrolysis and thus separate hydrogen from oxygen.
For this sweet water is required, which will become a scarce resource in this century. Thus it will be reasonable to place the wind farms close to the shores, desalinate the salt water and use it for electrolysis. The regions with the highest wind velocities and availability are close to the shores of Northern Europe: see map below. To generate e.g. 1TWh of energy, 270.000 tons of water have to be electrolyzed – 1 kg of H2 has an energy content of 33 kWh.
This requires the availability of a gas transport system in the area. This will be discussed in one of the following chapters. Off shore wind power potential in the near costs of Baltic Sea, North Sea and Atlantic Ocean are the most promising in Europe – this includes Spain and Morocco (Figures 13,14).
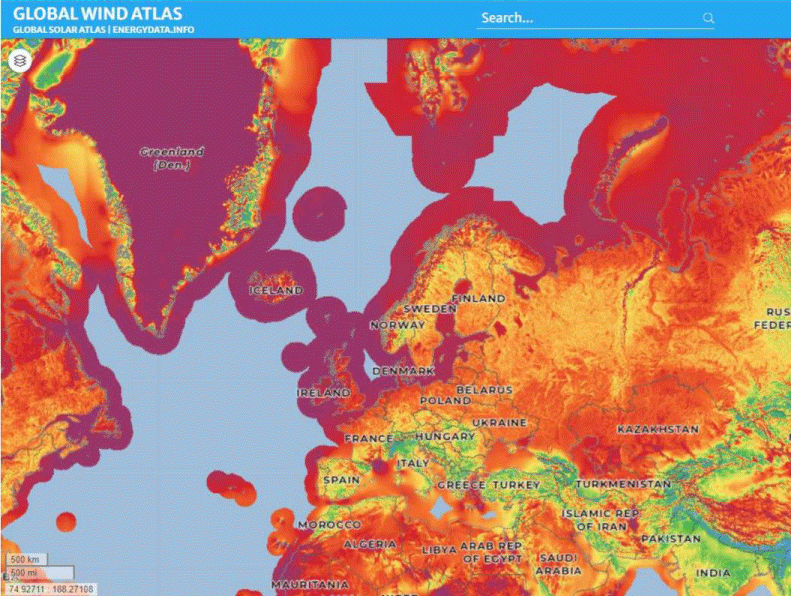
Figure 13: Wind atlas of Europe and Northern Africa. Source: Global Wind Atlas https://globalwindatlas.info/
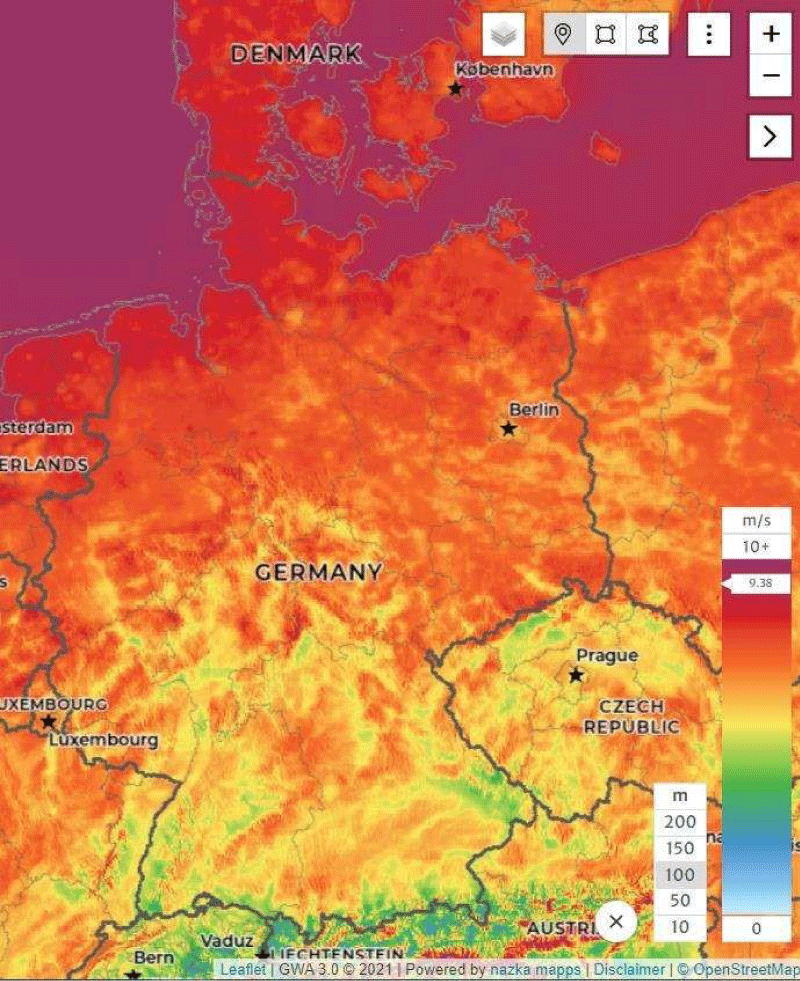
Figure 14: Wind atlas of Germany. Source: Global Wind Atlas https://globalwindatlas.info/
Photovoltaic
The Mean Levelized Cost of Energy for solar panels has been dropping drastically since several years. This is mainly due to the fall of the solar PV module prices, which have fallen roughly 80% since 2009, and with every doubling of installed capacity module costs plunge a further 20% thanks to economies of scale and the types of performance and efficiency improvements currently being seen. Furthermore, IRENA Forecasts 59% Solar PV Price Reduction By 2025, bringing the global average price of the electricity even lower (Figure 15).
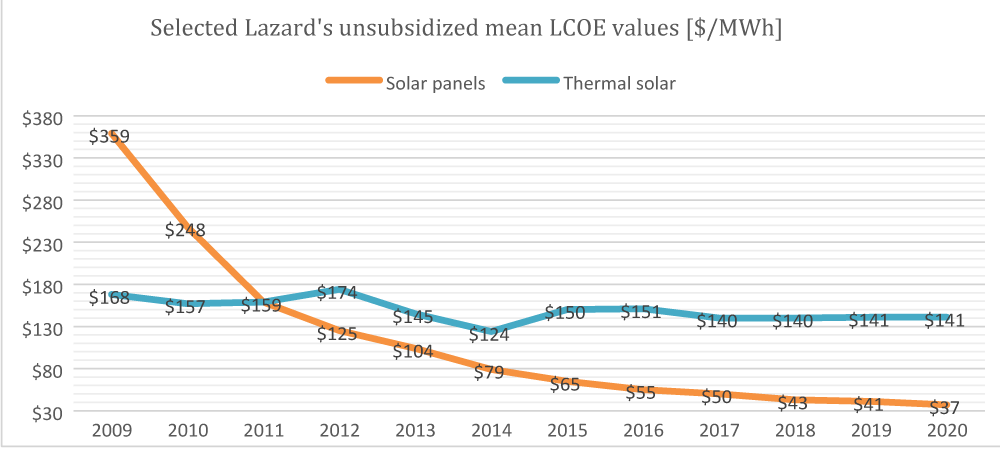
Figure 15: Mean cost of energy. Source: Lazard https://www.lazard.com/media/451419/lazards-levelized-cost-of-energy-version-140.pdf
The photovoltaic potential of Northern Europe is far less than Southern Europe and North Africa (Figure 16).
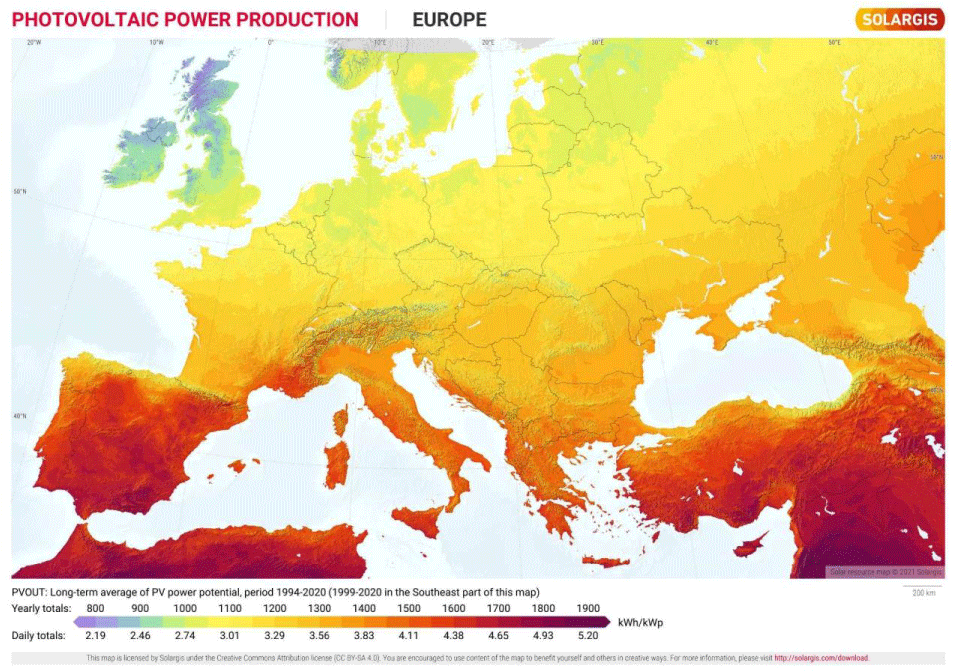
Figure 16: Photovoltaic power potential in Europe and nearby countries. Source: Solargis https://solargis.com/maps-and-gis-data/download/europe
For example, 100 kW solar panels in Hamburg, Germany would produce 86,600 kWh electricity per year, whereas the same 100 kW solar panels in Almeria, Spain would produce 159,600 kWh electricity per year.
Nevertheless, PV installations should be located all over Europe massively to provide local energy especially in summer.
Installing PV on commercial roofs is an excellent solution that can be excellently combined with heat pumps and e-cars/e-busses.
In Germany, per 1,000 m² of free roof area (e.g. flat roof, east-west) we get around 160 kW PV output and a yearly yield of around 144,000 kWh.
The total area of German flat roofs is around 1,200 km2. If we install solar PV on 50% of the total flat roofs in Germany, we would get around 86,400,000 MWh electricity per year. This is more than 7 nuclear power plants. A high self-consumption rates in business and private households (50% – 99%) are achievable. This way it is possible to use the produced energy directly and it is a relief to the Distribution Systems (Figure 17).
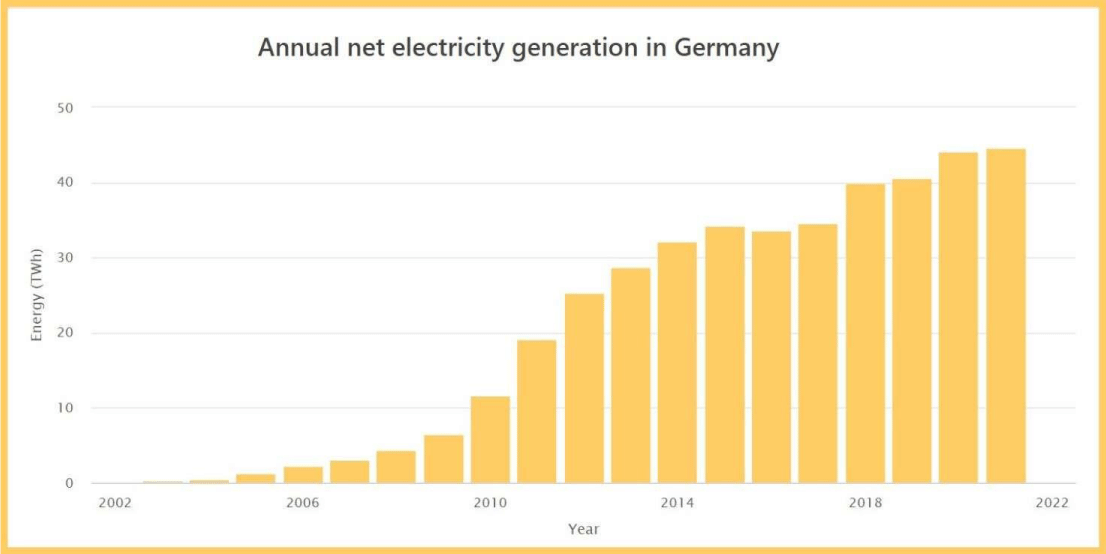
Figure 17: Source: Fraunhofer ISE https://ae-solar.com/wp-content/uploads/2022/01/2.jpg
Solar panels are volatile and produce certainly only when there is enough sunshine. The figure below is showing the contribution of solar panels to the electricity production in Germany (Figures 18).
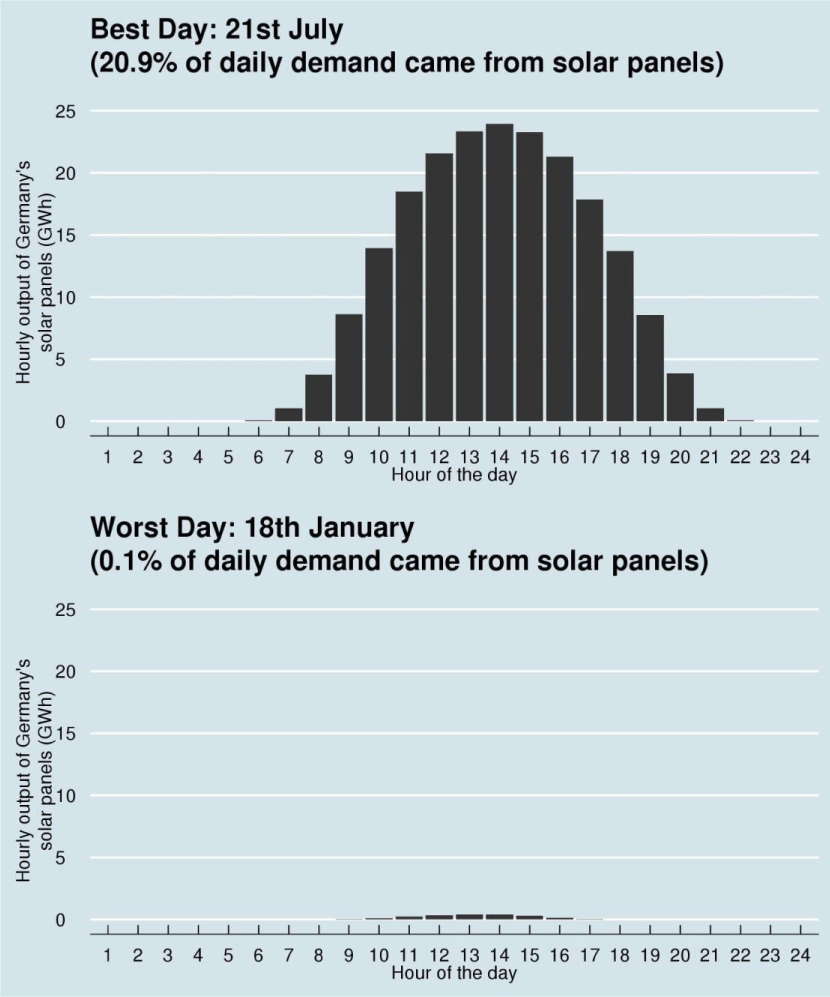
Figure 18: Best and worst day for PV generation. Source: energycentral https://carboncounter.files.wordpress.com/2014/08/pvhighlow.jpeg https://energycentral.com/c/ec/reality-check-germany-does-not-get-half-its-energy-solar-panels
The volatility of electricity production especially for the night and in summer can be balanced with battery storage, which could also be combined with the electrical vehicles (V2G) (Figure 19).
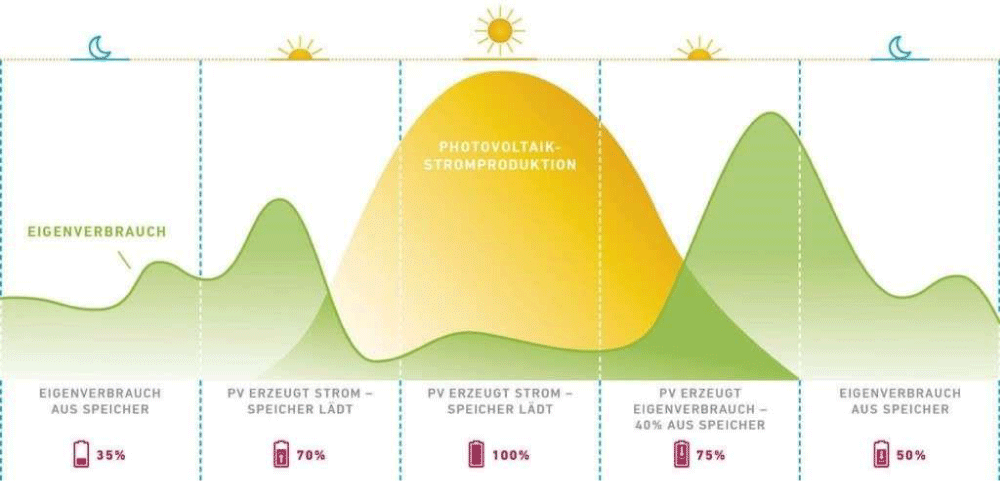
Figure 19: PV generation curve. Source: wvv Magazin https://magazin.wvv.de/energie/tipps-pv-speicher-sparen-wvv-solarenergie/
More PV farms can be placed on the countryside, where they can shade the ground in very hot regions. This can be a very promising way to combine solar PV with agriculture and animal husbandry.
Also, PV can be used to cover highways and waterways and also provide regional green energy (Figures 20,21)
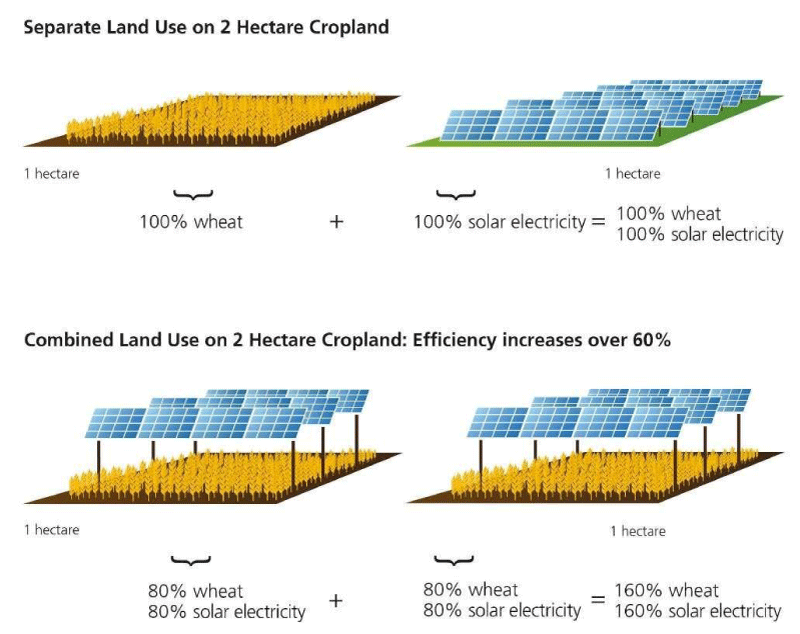
Figure 20: Setup options for PV farms. Source: Fraunhofer ISE https://www.ise.fraunhofer.de/content/dam/ise/en/images/press%20releases/2017/ APV_Grafik_20112017_final_en.jpg
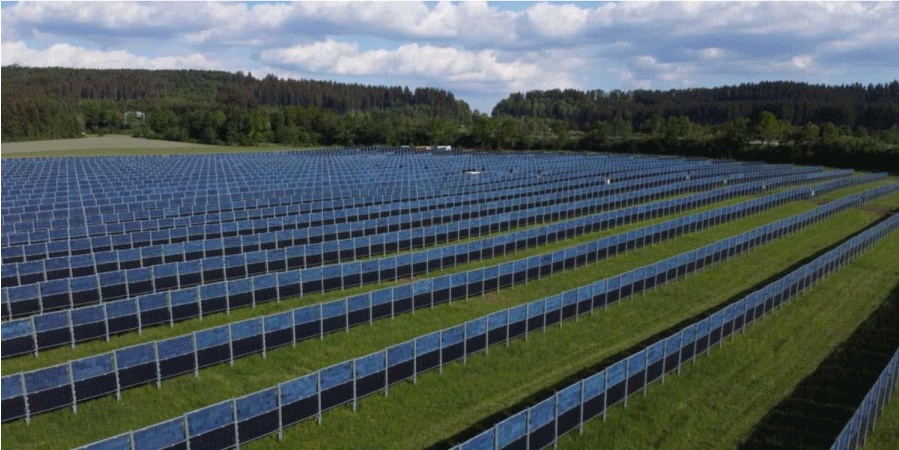
Figure 21: Bifacial PV farm. Source: Next2Sun https://www.pv-magazine.com/wp-content/uploads/2020/10/Next2Sun_Agro_PhotovoltaikAnlage_2020_Deutschland_Donaueschingen-scaled-e1602081655894-1200x600.jpg
Installing bifacial solar panels in farms could allow enough space for agriculture and yield electricity in the morning and evening hours.
China is controlling the global solar panel supply chain (Figure 22).
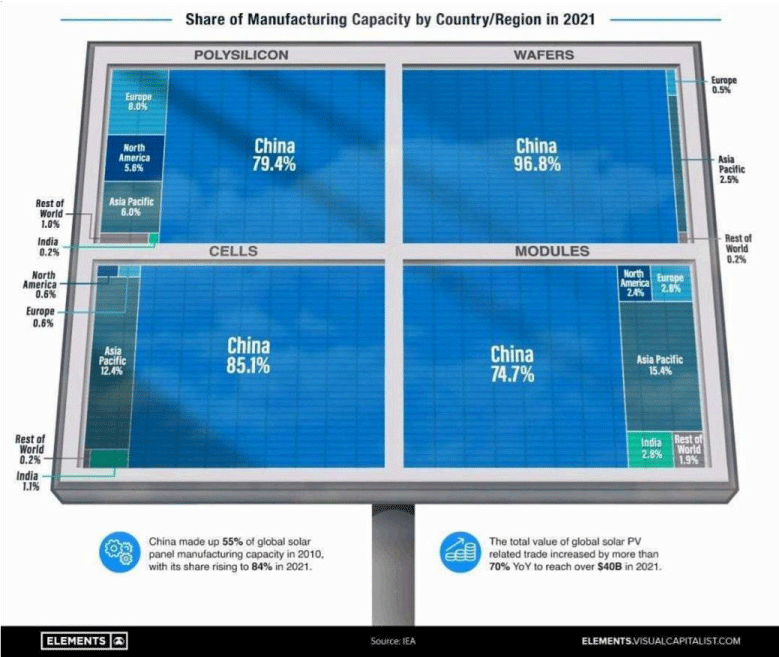
Figure 22: China PV panel production. Source: IEA https://elements.visualcapitalist.com/chinas-dominance-solar-panel-supply-chain/
Europe cannot even provide 1% of the needed ingots, wafers and cells for the solar installations (Figures 23,24).
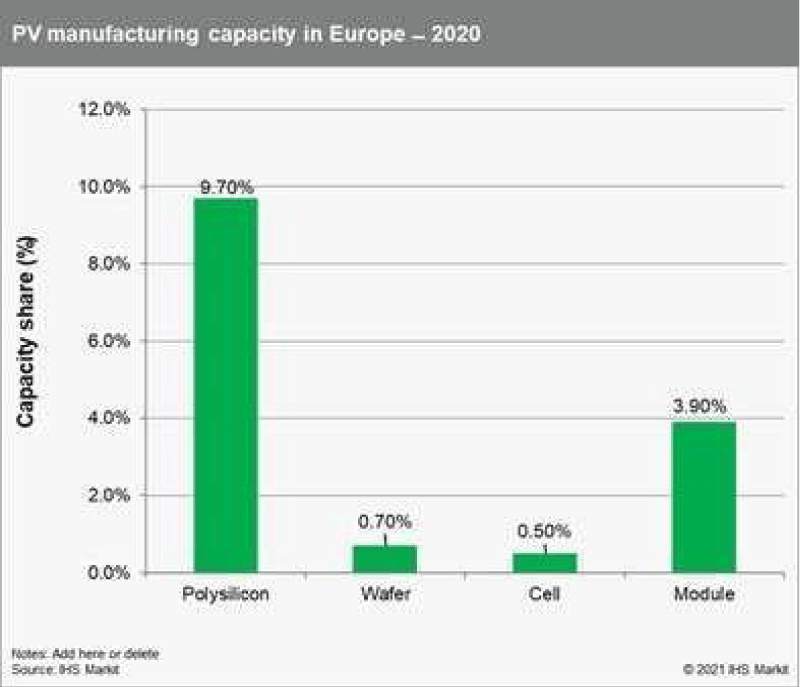
Figure 23: EU PV panel production. Source: IHS Markit https://www.greeneuropeanjournal.eu/making-europes-solar-future/
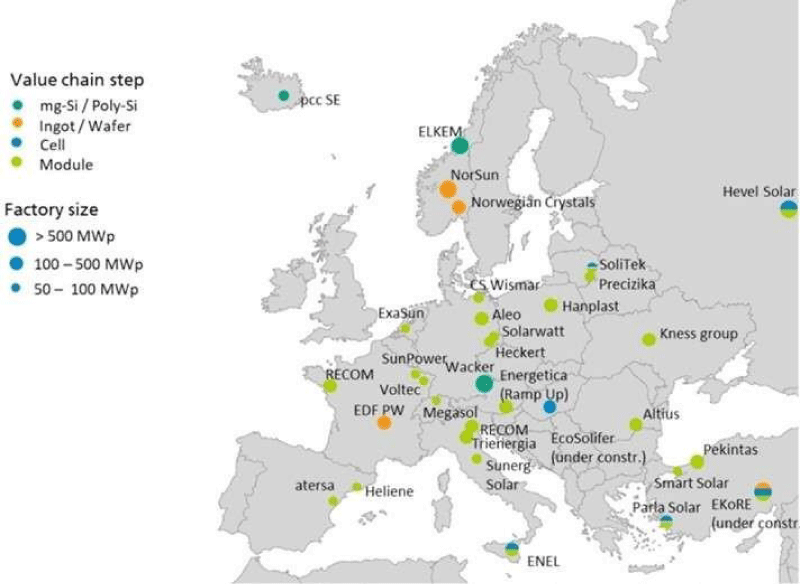
Figure 24: PV value chain in the EU. Source: Fraunhofer ISE https://eurec.be/eurec-public-workshop-strenght-through-cooperation-europes-pv-value-chainworking-together/
In order to be able to be deploy the needed PV panels in Europe, we need to invest strongly in the solar panel supply chain (Polysilicon, ingot, wafer, cell, panel).
Solar thermal
Solar thermal power plants are most efficiently located in the South of Europe since the sun is shining more than 1,5 times more than in the North - see picture XXX – and in a better angle: the latitude of Lisbon is 38,73 degrees, while Copenhagen is 55,67 degrees: this is almost 20 degrees closer to the equator.
The solar thermal power plants have to be located close to the coast since the heliostats have to be cleaned frequently; using freshwater for this purpose is not sustainable. The solar thermal power plants operate thermal reservoirs for energy storage and timed release; thus, a conversion P2X is not necessary, the power can be generated any time as long as the thermal reservoir is not depleted. In the meantime solutions are available which allow to make a precise management of the thermal reservoir and thus produce an electricity generation schedule.
Geo thermal
Geothermal: shallow and deep drilling: Deep drilling: the temperature rises around 30 degrees with every kilometer being drilled down. The earth shell is approximately 30 km thick. Below that we find fluid rock and metal. In 2045, industry is expected to consume 28.1% of the electricity in Germany (Figure 25).
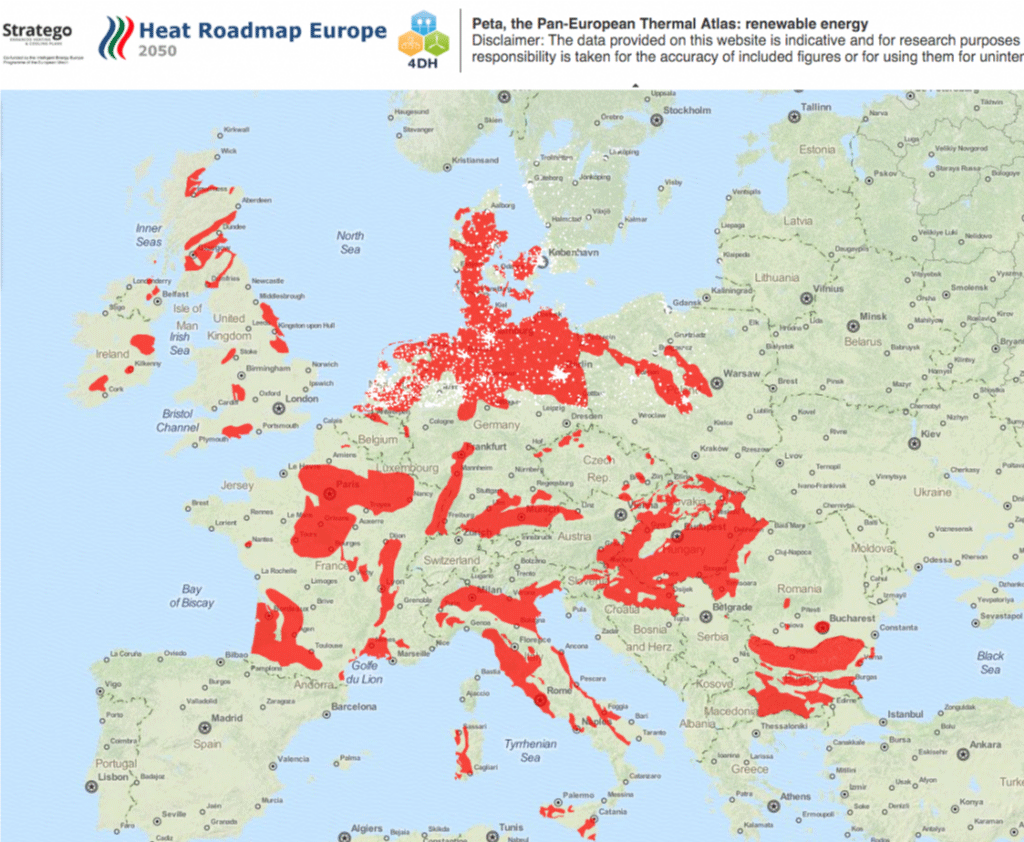
Figure 25: Potential for geothermal energy in Europe. Source: Heat Roadmap Europe https://www.jeotermalhaberler.com/interactive-map-showing-the-areas-with-geothermal-heatingpotential-in-europe/
What can be deduced is that Bulgaria, France, Germany, Italy, Slovakia and Romania have a high potential of deep geothermal energy.
In Germany this could replace the heating based on coal and lignite, in France a lot of electric heating could be replaced. In Italy the mountain areas could benefit also from geothermal energy (Figure 26).
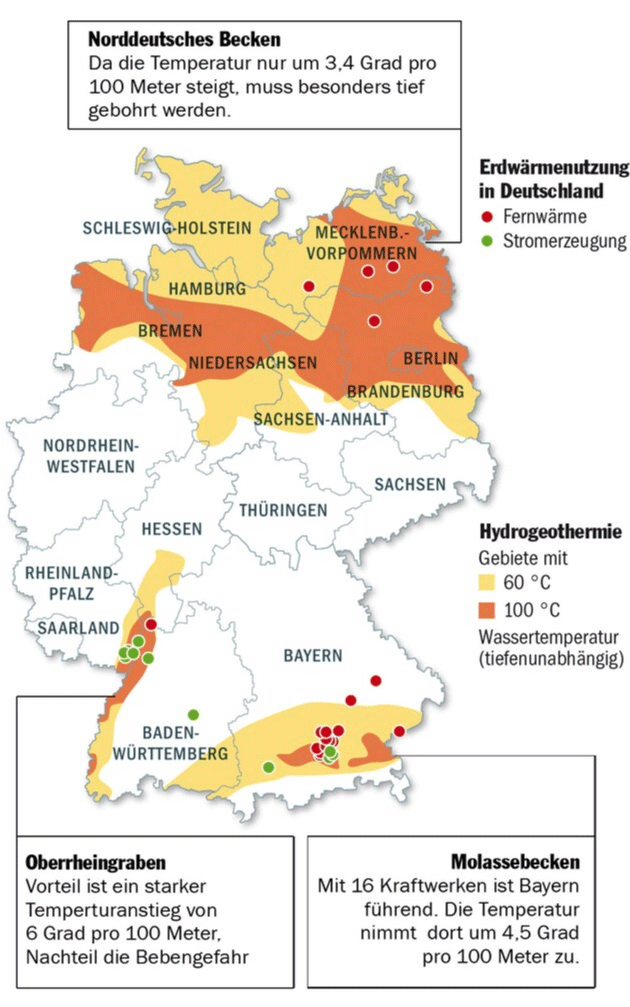
Figure 26: Potential of geothermal energy in Germany - shallow drilling. Source: Leibniz-Institut für angewandte Geophysik https://www.focus.de/wissen/klima/energie-aus-der-tiefe-geothermie_id_2336866.html
In the Northern part of Germany with two metropole cities - Berlin and Hamburg - there is a high potential of energy which can be generated from geothermal with shallow drilling. Also, Bavaria (BY) with the metropole city Munich and the greater area of Frankfurt in Hessen have a good potential (Figure 27).
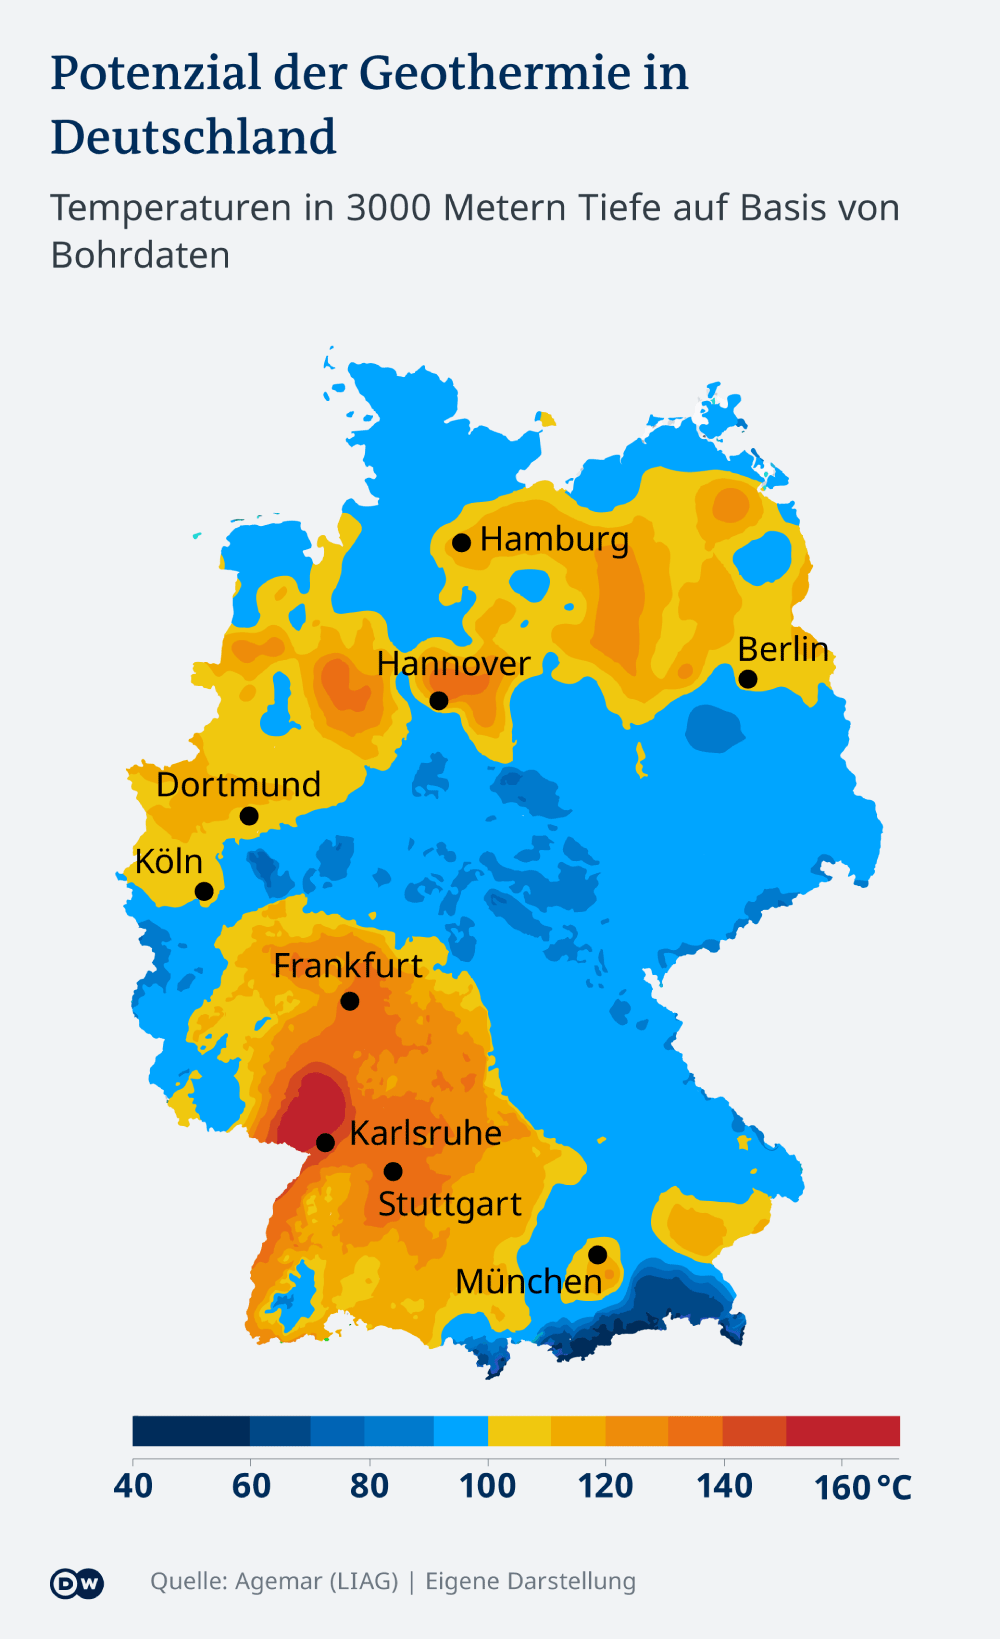
Figure 27: Potential for geothermal energy in Germany - deep drilling. Source: Agemar (LIAG) https://www.dw.com/de/wird-geothermie-zur-s%C3%A4ule-der-w%C3%A4rmewende/a-60643664
The potential of generating geothermal energy with deep drilling is high in North Rhine Westphalia (NW) and in Baden Württemberg (BW) and in the areas of Hannover, Hamburg and Berlin.
In NW and BW we find a major part of the German industry.
The conclusion is, that the most populated and industrialized areas in Germany have a high potential for the provision of geothermal energy, thus allowing to generate heating for the metropole and smaller cities.
The availability of hot water will via adsorber offer cooling as well. Cooling will become more relevant with the temperature rising due to the climate change.
Geo thermal potential: As already stated in the previous statements, the potential of geothermal energy is almost unlimited. In principle, however, one should differentiate between the different types and applications in geothermal energy.
Types of geothermal energy
• Solid rock geothermal energy, this type of geothermal energy is aimed at using the energy stored in the rock.
Hard rock geothermal energy is designed to find hot rocks and harness the heat they contain. It is also generally known as the Hot Dry Rock process.
Depending on the geothermal depth, hot rocks only appear at greater depths, which are generally more than 3000 m. usually with a temperature range of up to 200 C.
The energy is transported to the surface on the basis of water, by pumping, injecting and fracking.
• Surface geothermal energy, in which the heat potential contained in the top 10-100 m of the earth's crust is to be harnessed.
Surface geothermal energy has the most potential for use in the decentralized supply of heat to single-family homes using heat pumps, but also using geothermal probes or area probes, etc.
• Deep geothermal energy, here the warm water circulating in layer rocks, the aquifers, is used, hydrothermal systems for heat generation, a distinction can be made between highthermal and low-thermal waters, hydrothermal systems with high or low enthalpy.
Extended deep geothermal energy
In addition, there are new technologies that have already been developed that open up new fields and areas of application for geothermal energy and could also replace larger coal-fired power plants or nuclear power plants with combined heat and power (CHP up to 2.5 GW output per geoelectric power plant) as a practical alternative that could drive global transformation in energy production. These new types of geoelectric power plants differ in essence from conventional geothermal energy.
The aim here is to use new drilling technologies with sufficient diameter (6 - 12 m) and depth to bring shafts (vertical tunnels) to depths of more than 16,000 m in order to reach the temperature mark of 400 C for sufficient energy supply.
The energy is generated by means of a closed adiabatic system and the generation of steam, which drives turbines.
This new form of deep geothermal energy can be used after a maximum of 2-3 years of adapting existing technologies through research and development. A well can be realized in 18 to 24 months and a complete power plant construction after another 2-3 years. Another advantage of this technology is that existing power plant sites can be reused as part of the structural change.
Closed systems can be operated everywhere but require more power to operate them. Additionally small movements in the earth shell can break the pipes.
Heat exchanger systems: Heat exchanger systems can complement various energy technologies or as a separate system can also be used efficiently in a wide variety of areas for generating heat, hot water or cold.
Geo thermal power plants will be utilized mainly for district heating. They have to placed outside the cities and densely populated areas, since open systems can affect the ground below the power plant.
The most diverse types of heat exchange technologies can generate heat or cold energy for use in sheet piling on rivers and lakes, house and room walls, conservatories and in many other areas by means of a small temperature difference ΔT.
A quick implementation for use in the area, e.g. decentralized use, is possible.
Nuclear Power Plants (NPP)
Generation II reactors were designed to reliably cover a high electrical base load over a period of several decades (around 60; some up to 100 years). They were built from the 1960s and today represent the majority of reactor types still in operation worldwide.
Nuclear power plant safety: Nuclear Power Plants are among the safest sources of energy production (Figures 28,29).
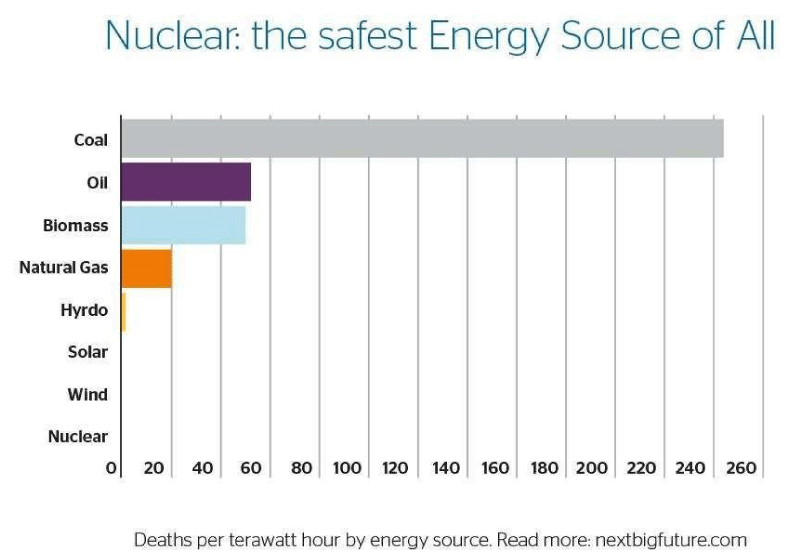
Figure 28: Safety of energy sources. Source: Next Big Future - Brian Wang https://www.nextbigfuture.com/2011/03/deaths-per-twh-by-energy-source.html.
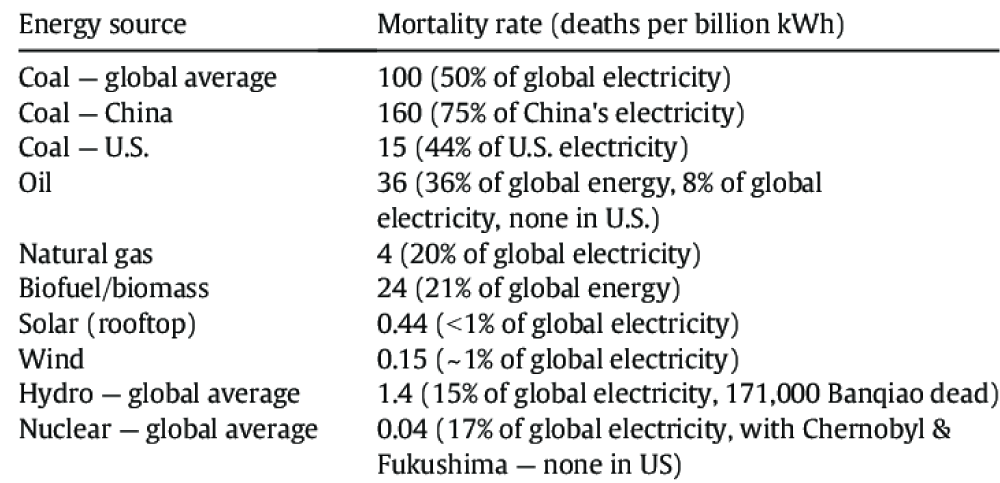
Figure 29: Mortality rate in connection with energy sources. Source: World Health Organization https://www.researchgate.net/figure/rates-for-each-energy-source-in-deaths-per-billion-kWhproduced-Source-Updated_tbl2_272406182
Generation III reactors have improved fuel technology, higher thermal efficiency, significantly enhanced safety systems (including passive nuclear safety), and standardized designs intended to reduce maintenance and capital costs.
According to GEN IV International Forum the Generation IV reactors include (relative to Generation II and III reactors):
- Nuclear waste that remains radioactive for around 300 – 500 years instead of several million years.
- 100–300x energy yield from the same amount of nuclear fuel
- Broader range of fuels, including unencapsulated raw fuels (non-pebble MSR, LFTR).
- Potential to burn existing nuclear waste and produce electricity: a closed fuel cycle.
- Improved safety via features such as ambient pressure operation, automatic passive reactor shutdown, alternate coolants and eliminating the need for external backup power source
- Usage for district heating
Germany is not a member of GEN IV International Forum.
Environmental aspects of nuclear power plants: Nuclear Power Plants are among the cleanest sources of energy generation in terms of greenhouse gas emissions (Figures 30,31).
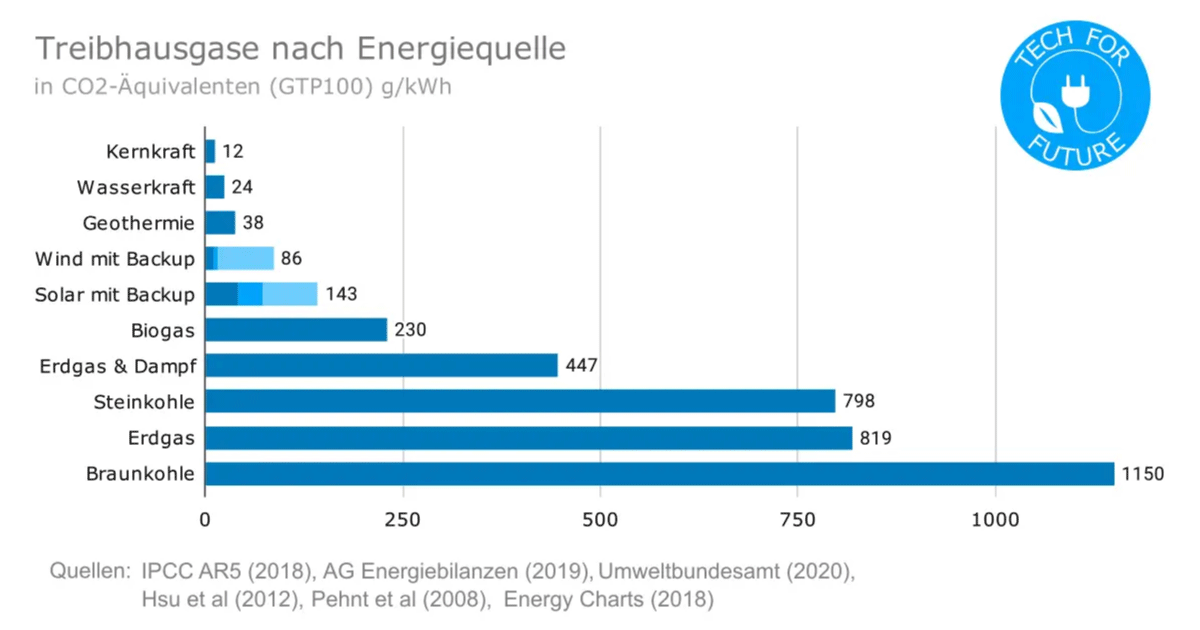
Figure 30: Greenhouse gas emission of energy sources. Source: Tech for Future; Data from IPCC, AG Energiebilanzen, Umweltbundesamt https://www.tech-for-future.de/CO2-kwh-strom/
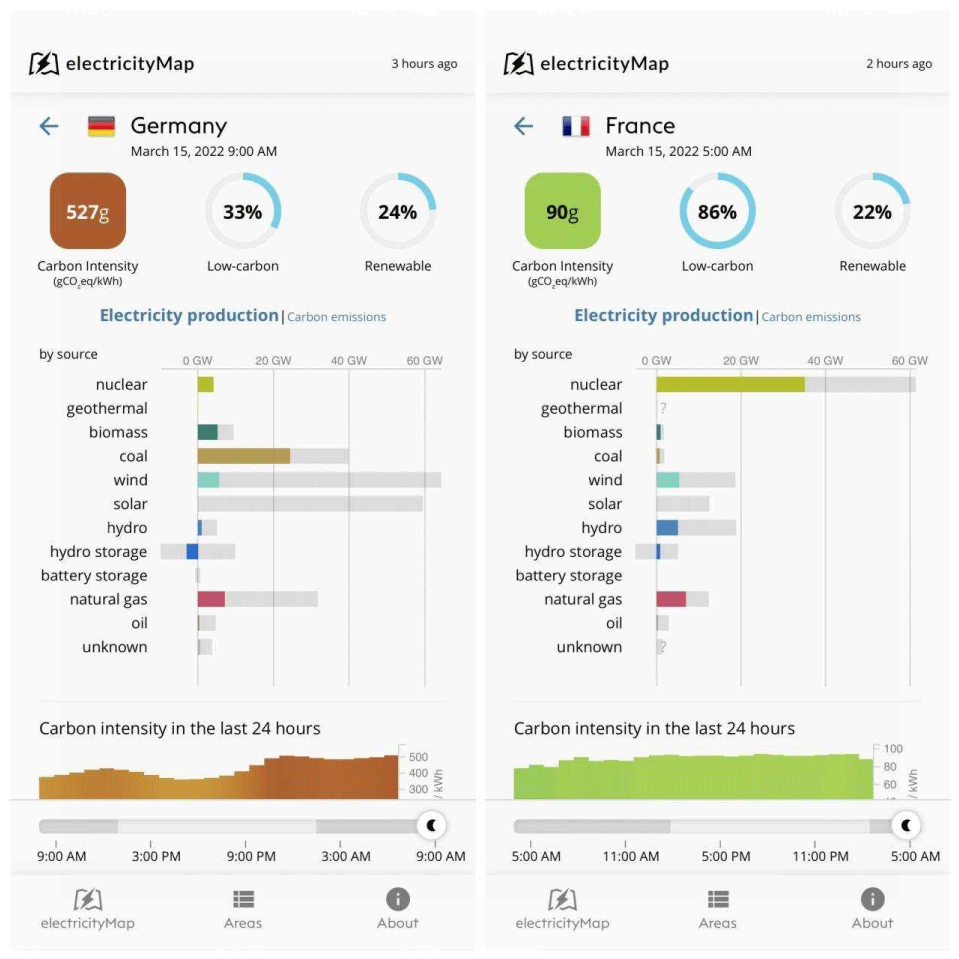
Figure 31: Energy generation sources in France and Germany (one day in April 2022). Source: Electricity Map https://app.electricitymaps.com/zone/DE https://app.electricitymaps.com/zone/FR
In Germany, generation II nuclear power plants have prevented more than 100,000 air pollutionrelated fatalities and more than 2 million worldwide.
Source: Iida Ruishalme, 2018. Saving Lives Is Not Shameful - Let’s Break the Stigma on Supporting Nuclear Energy. (https://thoughtscapism.com/2018/09/07/saving-lives-is-not-shamefullets-break-the-stigma-on-supporting-nuclear-energy/)
Energy density of nuclear power plants: Energy density of Nuclear Power Plants is extremely high compared with other sources of energy generation. Therefore, they occupy a much smaller area (Figure 32).
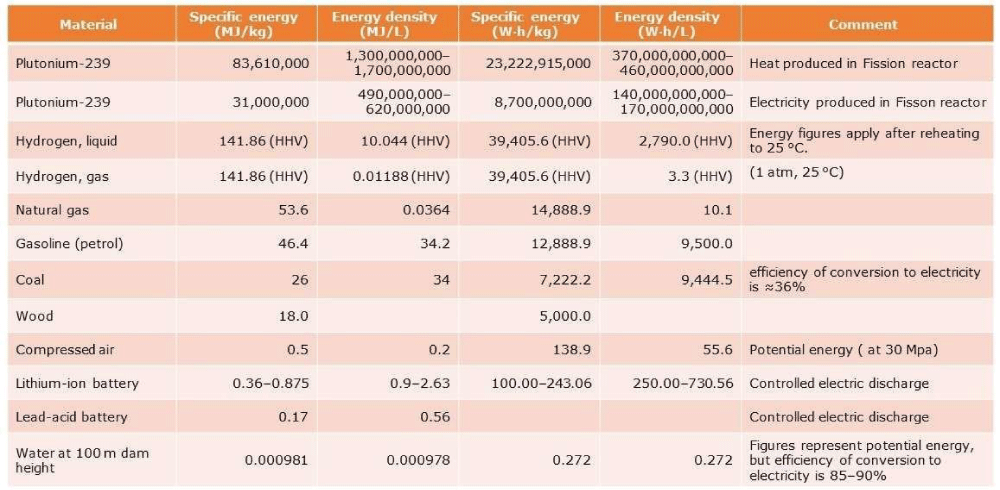
Figure 32: Specific energy of materials. Source: Wikipedia https://en.wikipedia.org/wiki/Energy_density
Nuclear Power Plants require less material than most other power generation sources (Figure 33).
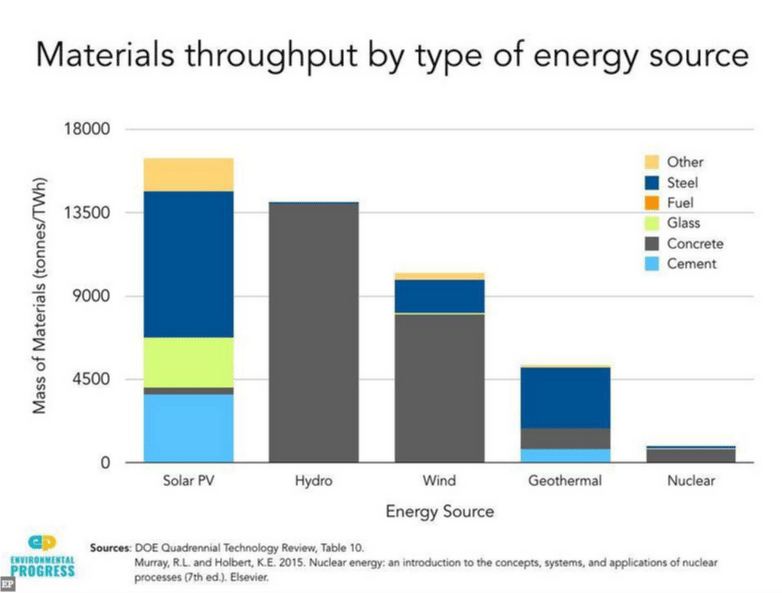
Figure 33: Material throughput of energy sources. Source: US Department of Energy https://climatecoalition.org/climate-impacts-renewables/
Current uranium resources and reserves: The Intergovernmental Panel on Climate Change (IPCC), also known as the "World Climate Council", estimates the economic uranium reserves at a price of $260 / kg U at 7.1 Mt. This would cover current requirements for more than 130 years. This time would double if it became more economical to develop additional uranium reserves of 7.4 Mt.
The oceans hold more than four billion tons of uranium [2] --enough to meet global energy needs for the next 10,000 years if only we could capture the element from seawater to fuel nuclear power plants. Major advances in this area have been published by the American Chemical Society's (ACS) journal Industrial & Engineering Chemistry Research.
https://www.sciencedaily.com/releases/2016/04/160421171202.htm
High level radioactive waste: Only 3% of radioactive waste is high-level-waste (HLW), see:
https://world-nuclear.org/information-library/nuclear-fuel-cycle/nuclear-waste/radioactive-wastemanagement.aspx
Most of the highly radioactive nuclear waste is in spent nuclear fuel rods. These rods can be reprocessed to recycle uranium and plutonium as fuel for fast breeder reactors. These elements make up about 95% of the weight of the used rods, so recycling reduces the volume of nuclear waste.
Approximately 99% of the radioactivity in spent fuel decays within 50 years [3]. The fuel rods can be safely stored in a dry place and then recycled. More advanced methods such as transmutation cause the radioactivity of the waste to reach the level of the original uranium ore at a maximum after another 300 years.
https://world-nuclear.org/information-library/nuclear-fuel-cycle/fuel-recycling/processing-of-usednuclear-fuel.aspx
At the moment, however, it is cheaper to mine and enrich fresh uranium.
Reliability of nuclear power plants and their construction time: Nuclear Power Plants are very reliable. The six remaining functioning NPPs in Germany (Three of them have been stopped already end of 2021) had an average availability of around 90% during their whole operation life cycle.
The construction time, safety and availability of the NPPs in Germany have been improving over the years (Figure 34).
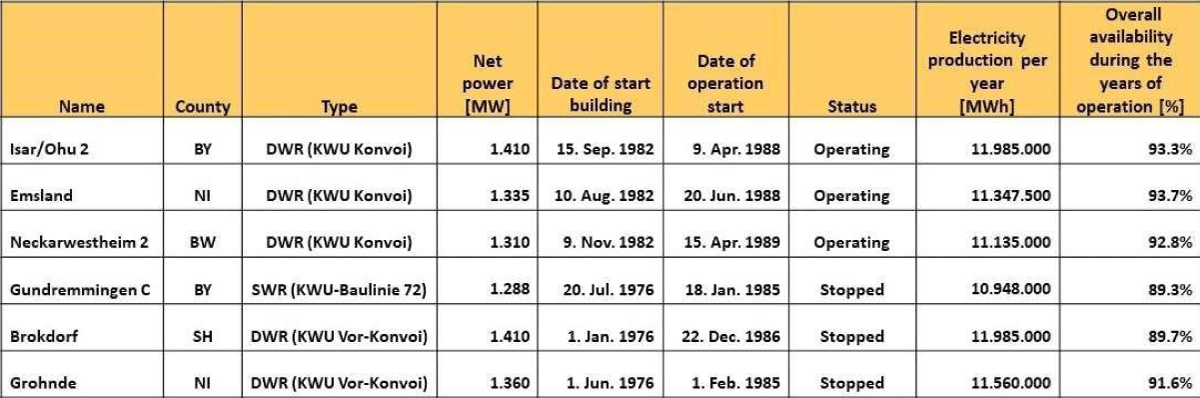
Figure 34: Remaining 6 NPPs in Germany. Source: Wikipedia https://de.wikipedia.org/wiki/Liste_der_Kernreaktoren_in_Deutschland
The new Small Modular Reactors promise a very fast implementation and usage of their NPPs.
For example, the Westinghouse eVinci Micro-Reactor Mobile NPP is planned to be fully factory built and assembled, with fueling stages lasting eight years before the next refueling with following features:
- Combined heat and power (CHP) by a capacity of 5 MW electricity and 13 MW thermal.
- Transportable energy generator
- 8+ years of full power operation prior to refueling
- Target less than 30 days onsite installation
- High reliability and minimal moving parts
- Capable of autonomous operation
- Near zero Emergency Planning Zone with small site footprint
- No spent fuel or waste storage on site
- Simplified decommissioning and remediation
- Price tag: 28 million USD
Not only new innovations in type of the NPPs promise fast and safe deployment, but also automation of the procurement and building processes can lead to a faster and cost-effective implementation of NPPs.
Open100 is an open-source NPP project with following features (Figure 35):
Figure 35: Features of Open100 NPP. Source: Open100 https://www.open-100.com/engineering https://analytics. zoho.com/open-view/2302819000000010557/289737b7abeae16ee37e96f2ef455aa8
Integration of nuclear power plants in the future EU energy landscape: Next generation NPPs can be integrated in the EU energy landscape together with a massive expansion of solar, wind, geo thermal and also with an increasing smart grid and software infrastructure and next gen utilities.
"NPPs can produce cheap and clean pink hydrogen—hydrogen generated using nuclear energy—in large quantities. They can also capture CO₂ via Direct Air Capture and contribute not only to the survival of industries in the EU but also to the clean production of green ammonia, e-methanol, green steel, green aluminum, silicon wafers, glass, cement, and other electricity-intensive products.
Since there are countries like Germany, Austria, Denmark and Portugal, who are not in favor of the NPPs, new NPPs should be built in other EU countries (Figure 36).
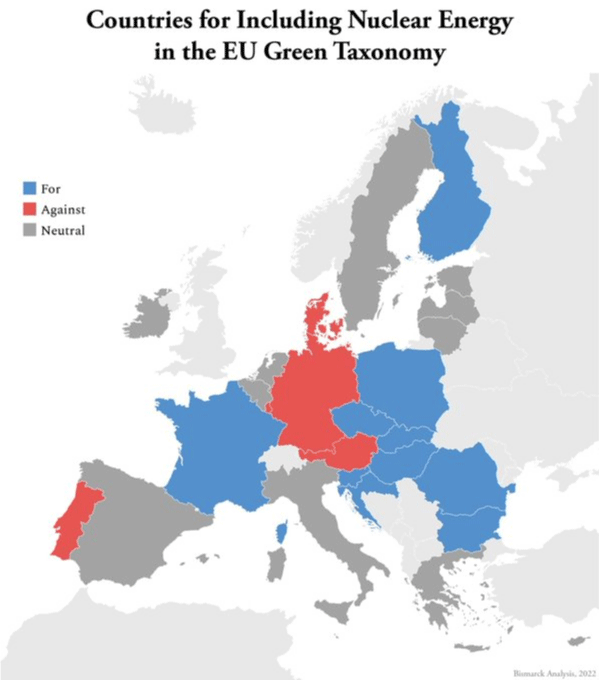
Figure 36: EU countries supporting or preventing NPPs. Source: Bismarck Analysis https://twitter.com/bismarckanlys/status/1514711235702439940
Note that recent NPP installations have taken approximately 15–20 years in the Finland, France and in the Czech Republic.
Cooperation requirements
The energy transition can be accelerated by cooperation of the EU with reliable, cooperative countries which have traditionally a positive cooperation with the EU in the greater area and with energy transfer facilities like electricity transmission systems and gas pipelines. Using LNG is also a possibility, however it is less efficient. Within the EU any energy transfer should be based on the available and potentially upgraded transport systems (TSOs).
Requirements for energy storage
The generation based on PV and wind is volatile. Since electrical energy has to be generated and consumed at the same instant, a de-synchronization must be implemented-unless buffered through storage systems like batteries or hydrogen. This can be achieved using large storage.
Geothermal energy contributes to stability due to its baseload capability.
Storage potential: Hydrogen, EV and stationary batteries, pump water storage
The storage to be used should ideally be available without additional investments. The storage can offer an “added value”.
Hydrogen
Hydrogen is a key chemical vector in the energy transition. It will replace the fossil fuels. The generation will take place as “green hydrogen” generated by RES devices, primarily wind turbines onshore and offshore.
In 2045, hydrogen production is expected to consume 21.5% of the electricity in Germany.
Efficient electrolysis
Electrolyzers currently have an efficiency of 70% - 80%. New methods may be up to 98.7% efficient [4,5], see https://techxplore-com.cdn.ampproject.org/c/s/techxplore.com/news/2019-09-watersplitting-technique-hydrogen.amp
Avoid hydrogen leaks
Currently, up to 10% of the hydrogen produced disappears into the air. Hydrogen is lost during electrolysis, compression, refueling and reconversion in a fuel cell. Hydrogen in the atmosphere has a greater climate impact than CO₂. Leakage of hydrogen into the atmosphere will decrease the tropospheric concentration of hydroxyl radicals (OH), the major tropospheric oxidant, and thereby increase the atmospheric lifetime of methane and its impact on climate (https://assets.publishing.service.gov.uk/government/uploads/system/uploads/attachment_data/file/ 1067144/atmospheric-implications-of -increased-hydrogen-use.pdf)
EV batteries
The e-mobility with the EV batteries and the expected fixed batteries in connection with reverse charging (V2G) will offer one opportunity. A rough calculation however shows, that these storages are not sufficient.
Remark
- 40 million EVs in Germany will be able to store 1.6 TWh (40 million EVs x 40 kWh/EV) - the daily consumption in Germany is presently almost the same value (630 TWh/a divided by 365 days = 1.73 TWh) and will increase in the near future due to the sector coupling. Even if the EVs were fully charged and would not be used and all of them were connected via V2G, they would only be able to provide energy for less than one day.
- Charging parks will have storage with a capacity of 1 digit MWh - if we assume to have several thousand of them, they will only be able to store energy in the range of 2 digit GWh.
Pumped water storage
The potential of pumped water storage in the EU is around 7 GW (power). The efficiency of these storage is close to 95%. These devices can store 4 TWh per year.
The available, additional potential by small lakes, closed mining sites and mining waste disposal is estimated by experts around 3,5 TWh per year. However there is a strong resistance in Germany against new water pumped storages - e.g. the Schluchsee AG in the Black Forest close to the city of Atorf is planning one, the local population raised heavy protest against this and the planning could not be finished.
Pumped water storage had lost its economic value due to the drop of energy prices in the years before the Russian aggression in the Ukraine. Presently it would be valuable again - but there is no way to set up more storage short term.
https://www.springerprofessional.de/en/wasserkraft/energiespeicher/pumpspeicher-in-deutschland-nur-begrenzt-ausbaufaehig/12169480
Long-duration Energy Storage (LDES)
Renewable Energy Sources (RES) are expected to become the most relevant source of energy and will have to replace the carbon based energies ASAP. Since the presently most relevant RES, i.e. wind and photovoltaic are volatile, a permanent energy supply cannot be guaranteed.
Electrical energy is typically been generated and consumed at the same time. The demand is forecasted and announced to the Transport System Operators (TSOs), at the same time the generating sources have to be planned and declared. The process is called balance group management.
RES cannot be made available all the time, thus they have to be stored whenever the generation is higher than the demand and have to be taken from energy storage when the demand is higher than the generation. Most efficiently any already existing energy storage would be utilized.
RES providing electrical energy only count for around 20% of the primary energy being utilized, the residual part is energy for heating and cooling, for the industry and for mobility purposes. This will change in the near future, mobility will be based on electrical vehicles, heating will be based on heat pumps („sector coupling“) plus deep drillings for geothermal sources. We live on the average only 30 km above the very hot and fluid core of the Earth.
Existing storage are the batteries of the EVs and stationary batteries of charging parks and commercial buildings. However, even if e.g. in Germany we expect around 30 million EVs, the storage will count for 30 million EVs x 60 kWh/EV = 1,8 TWh. That is less than the present, average daily consumption of electrical energy in Germany. Stationary batteries will have an average capacity of 1 MWh, again with 1 million of these batteries – most likely redoxflow batteries – will offer only another 1 TWh of storage. And the consumption of electrical energy will grow rapidly. However the batteries could store the energy which is generated during the night, since in the night the load goes down to 20% of the daily load and renewable energy sources are often curtailed.
With the generation of green hydrogen and the feeding of thermal reservoirs another way of storing energy is available. Solar energy can also be used to generate heat and later electrical energy using solar thermal power plants. These power plants have a thermal storage and would be used in the regions where the sun is shining with the highest number of yearly hours and which are connected to the European Synchronous System (UCTE): Southern Europe and North Africa. Political stability is relevant, preferred locations would be Morocco and Tunisia.
In the Northern European countries wind is offering the highest generation power. The energy will be used to produce hydrogen via electrolysers using desalinated seawater i.e. close to the sea, preferably on artificial islands – freshwater is getting scarce in Europe. The hydrogen would be transported by upgraded gas pipelines to gas storage. Pipelines and storage are available in sufficient sizes in Europe. Using pipelines is more efficient than LNG, where hydrogen would have to be compressed to liquid and later re-gasified: this is only an interim technology for natural gas.
Other energy storage like pumped water, kinetic energy, compressed air and the like do not have a relevant capacity. Converting hydrogen into ammonia, transporting it and then „cracking“ it is again not efficient at all.
Solar thermal generation
Another approach is to have solar thermal power plants that operate with thermal storage. The southern EU countries have a potential of up to 60 GW power.
Requirements for storage, transport and distribution of hydrogen
It has already been proved that hydrogen can be transported and distributed via pipelines for natural gas. If the hydrogen content is 100%, an upgrade of the pipelines mainly the necessary facilities like compression, valves and metering has to be done.
Among all the energy supplies and technologies discussed, natural gas and its infrastructure will continue to play a major role in the EU's energy resilience over the next decade and beyond. For our economy, the value of today's gas industry lies in the robustness of its infrastructure and the expertise available to facilitate a transition from natural gas to green gases, including but not limited to hydrogen.
In the following a closer look at the existing gas infrastructure will demonstrate a significant economic impact when incorporating the existing gas systems into the future energy system, as opposed to prematurely abandon the mid-stream infrastructure as result of displacing natural gas from the energy.
"The energy resilience of Europe has become highly critical for approximately the next 2 to 3 years due to the Russian war in Ukraine. The supply of natural gas due to its large import share from Russia is most affected and the preferably on artificial islands, as freshwater is becoming scarce in Europe. Beside the supply constraints from Russia the energy transmission with shifting to a climate neutral energy system by 2050 in the EU is setting the frame and accelerating the speed of change. Analyzing the functions of today’s value chain will allow to understand the current and future risks for an affordable and secure energy system meeting our ambitious climate targets.
EU resilience of existing gas markets and Import capacities from non EU: In absolute capacity figures, Europe´s gas import terminals - pipeline and LNG facilities provide for EU sufficient capacities even without Russian supplies, however bottlenecks within the system do not guarantee full flexibility yet (Figure 37).

Figure 37: EU gas utilization and sources.
EU gas utilization of import capacities: Based on 2021 figures theoretically 730 TWh/a unused import capacities of LNG and without Russia another 550 TWh/a in EU are still available. Additional 200 TWh/a spare LNG capacities in the UK are also available to EUs which could nearly match the interruptions from Russia expected to be between 100-150 bcm/a. In principle, existing infrastructure allows additional import volumes from Norway and North Africa, and additional LNG volumes, which together could displace imports from Russia However for the upcoming and approx. till beginning of 2024 the sourcing of gas on the global market will be the largest challenges, beside several transport bottlenecks from high utilization of LNG requiring increased west east flows.
In addition, immediate action into the infrastructure is also needed to make to create full flexibility and access to all import capacities:
Bottlenecks exist currently for three reasons:
- Markets are not connected i.e., Spain and France
- Technical constraints in the grid, bottlenecks due ability of reverse flows
- Operational constraints, such as variations in gas quality or differences in odorization practices across countries.
One example for a missing interconnection of a market with large import capacity is Spain which is lacking export capacities to France.
Spain and Portugal have LNG import capacities of appr. 800 TWh/a appr. 25 % of EU`s total LNG import capacities and another 220 TWh/a of pipeline gas from Algeria. Thus, Spain’s import capacity is three times bigger than the country’s annual consumption (Figures 38,39).
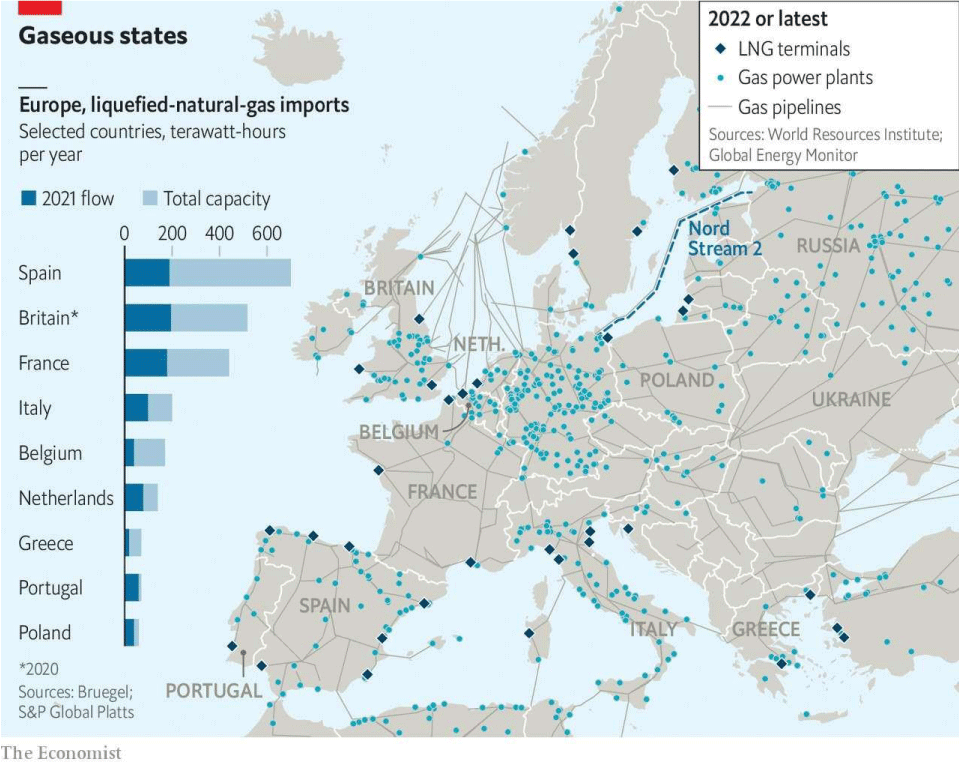
Figure 38: LNG terminals and natural gas pipelines in Europe. LNG terminals and natural gas pipelines in Europe https://ec.europa.eu/energy/sites/ener/files/hydrogen_strategy.pdf
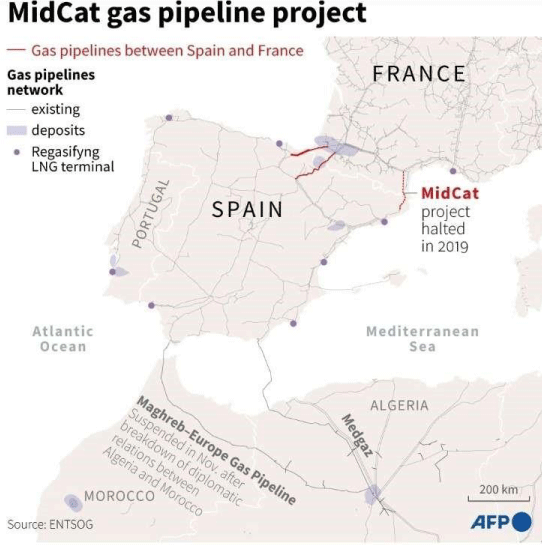
Figure 39: MidCat gas pipeline to the EU. https://eur-lex.europa.eu/legal-content/EN/TXT/uri=COM 3A2022%3A230%3AFIN&qid=1653033742483
Initially in 2003 France and Spanish gas operators launched, the 190-kilometre Midi-Catalonia (MidCat) pipeline which would pump gas across the Pyrenees from north of Barcelona to Barbaira in southern France. Its aim was to transport gas from Algeria through Spain to the rest of the European Union. There are currently only two small gas pipelines linking Spain and France with a capacity of less than 60 TWh/a.
With higher transport capacities from Spain to France and minor upgrades to Germany and Benelux, the French gas industry would be able to make additional capacities in France available for exports to the markets in Benelux, Germany, and Eastern Europe.
Particularly with a long-term view to the favorable conditions to produce hydrogen in Spain and North Africa and the fact that France seeks to reduce the use of nuclear energy by 25% by 2050 this project should be revived in European context. Even though the project was stopped with political, and industry support such the pipeline could be realized as of 2026.
Already in 2009 in the first gas crisis with Russia the reverse flow capacities from west to east have already been upgraded particularly to south-eastern Europe. Further debottlenecking is required from France and Benelux towards Germany in order to allow for full flexibility of the LNG capacities to the German and eastern gas markets even without Russian supplies.
The north-eastern countries Poland and the Baltic countries will replace their Russian supplies with recently developed LNG terminals in the Baltic Sea whereas the south-eastern region has access to the TANAP system delivering gas from Azerbaijan as well as LNG and pipeline gas from north Africa.
In Germany the government has after Russian invasion announced to support three LNG terminals with also the obligation to become hydrogen ready in the future.
The value of existing infrastructure for future energy systems: If in the future the high carbon energy carriers coal oil and finally natural gas shall be replaced by climate friendly gases a large infrastructure will be necessary. Therefore, today’s energy use in Europe is only 20% electric whereas the remaining 80% consumed are from solid, liquid, or gaseous fuels mostly fossil. Whereas the future energy system will most likely be close to 80% electric.
The characteristics of renewable electricity generation is the need of a continuous balancing, and the electricity infrastructure is already reaching its limits in terms of capacity and storage. The main challenges in this disruptive energy transmission are the need to minimize and ensuring social acceptability without jeopardizing the security of supplies. Because non-electric energy carriers store energy in molecules and provide a more robust and flexible energy distribution hydrogen and other green gases /fuels will be in future the most suitable energy carrier. Therefore, combining green gases with electricity in a sector coupling and an even stronger mutual integration towards the planning and development of the electricity systems is crucial.
The role of green gases was also concluded by the EU In its hydrogen strategy that hydrogen or derivatives will be the future energy carrier of choice. This strategy has been updated in February 2022 in the RePowerEU plan because of the Russian war in Ukraine and accelerated again the speed of transmission and the diversification of supplies for a resilient energy system.
However, the European Commission’s details in the updated hydrogen strategy also the sourcing, meaning 10 Mt production of hydrogen in 2030 and another 10 Mt of imports will be required from the outside of EU.
Even if due to the Russian supply disruptions the EU’s gas consumption will decrease at a faster pace, the role of gas as a transitional fuel even then is crucial for the security of supply. The RePowerEU Plan acknowledges that shifting away from Russian fossil fuels will still require targeted
Investments for security of supply in gas infrastructure such as LNG import terminal, gas fired power plants etc. alongside large-scale investments in the electricity grid and an EU-wide hydrogen backbone.
In order to make this transition affordable, which means also socially fair and acceptable using and repurposing this existing gas infrastructure for green gases mainly hydrogen in the future will have an enormous economic impact.
Frontier Economics has evaluated the value of using the existing gas infrastructure as opposed to an all-electric scenario with expanding only the electricity grids for the German Market. Their power grid model simulates how the use of the gas grids reduces the need to expand the electricity transmission network by about 40%, in the distribution grid even by 60% with cumulative savings of approximately € 113 billion till 2050. Another important but less quantifiable value is that the gas networks are already existing and installed underground. This is also essential for the social acceptance of this energy transition (Figure 40).
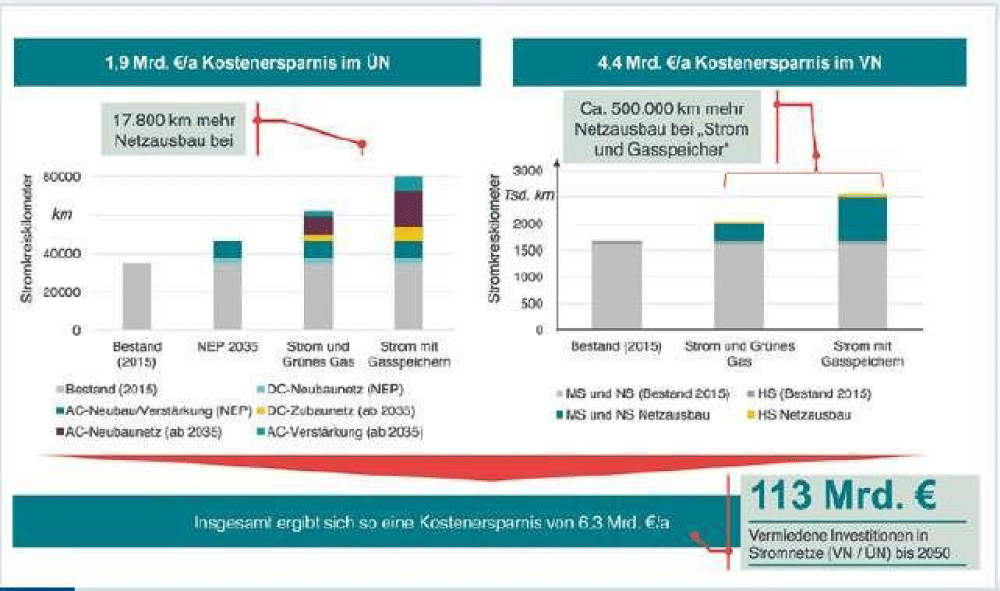
Figure 40: Utilization of pipelines to avoid investments in electricity grids. Frontier Econmics, IAEW, 4M und EMCEL: Der Wert von Gasinfrastruktur für die Energiewende in Deutschland – Eine modellbasierte Analyse
Forecast upgrade of natural gas pipelines
Using hydrogen instead of natural gas can be achieved in gas-fired power plants, CHP units, and ICEs with an upgrade that, according to relevant market players—Siemens, Hitachi, Fujitsu, and Janitzer—is not expensive.
Energy storage comparison by capacity, cost, and efficiency (Figure 41).
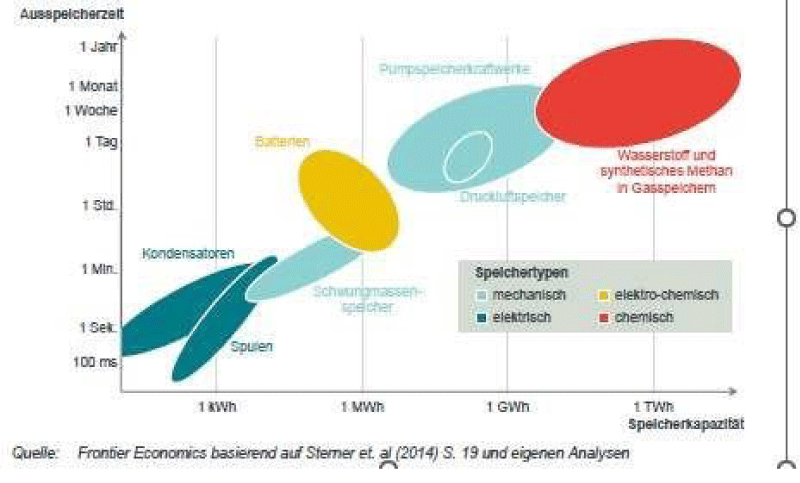
Figure 41: Energy storage solutions. https://www.gie.eu/gie-presents-new-studypicturing-the-value-of-underground-gasstorageto-the-european-hydrogen-system/.21 METIS study on costs and benefits of a pan-European hydrogen infrastructure (2021)
Equally as important are the gas storages because the most efficient way to store large quantities of energy is in underground gas storages i.e. in salt caverns. With the increased need of green gases and an efficient sector coupling in order to avoid an excessive electricity infrastructure gas storages should be used in future also to store hydrogen.
In the early stage of hydrogen market development local production and consumption of hydrogen (including storage) will be possible in many cases (e.g. hydrogen valleys), especially in a developing market when the industry has switched and the heating market which is determined by its seasonal nature underground storages become necessary.
GIE, the association of European gas storage operators in 2021 estimated that repurposing and refitting all existing European natural gas sites to hydrogen would lead to working gas capacity of 265 TWh hydrogen storage, of which 50 TWh in salt caverns and 215 TWh in gas fields and aquifers. The role of underground hydrogen storage is expected to vary from country to country and is subject to the regional energy market dynamics (Figure 42).
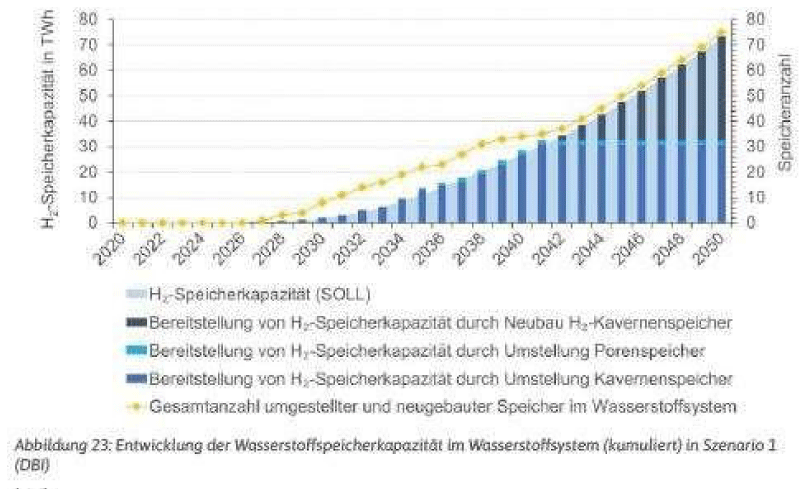
Figure 42: Hydrogen storage potential in the EU. https://erdgasspeicher.de/wp-content/uploads/2022/06/20220610_DBI-Studie_H2-speichern-sovielist-sicher.pdf
Hydrogen has successfully been stored in salt caverns at several locations for many decades. In other formations i.e. depleted oil& gas reservoirs and aquifers the storage of hydrogen is more difficult with regards to chemical processes of the hydrogen in these reservoirs and the high quality requirements for hydrogen. Therefore, the development of underground storages of hydrogen focuses currently on salt caverns. Due to the strong demand for hydrogen and the favorable geology of salt domes and the availability of existing gas caverns storages about the EUs highest potential for hydrogen underground storage will be in Germany (Figure 43).
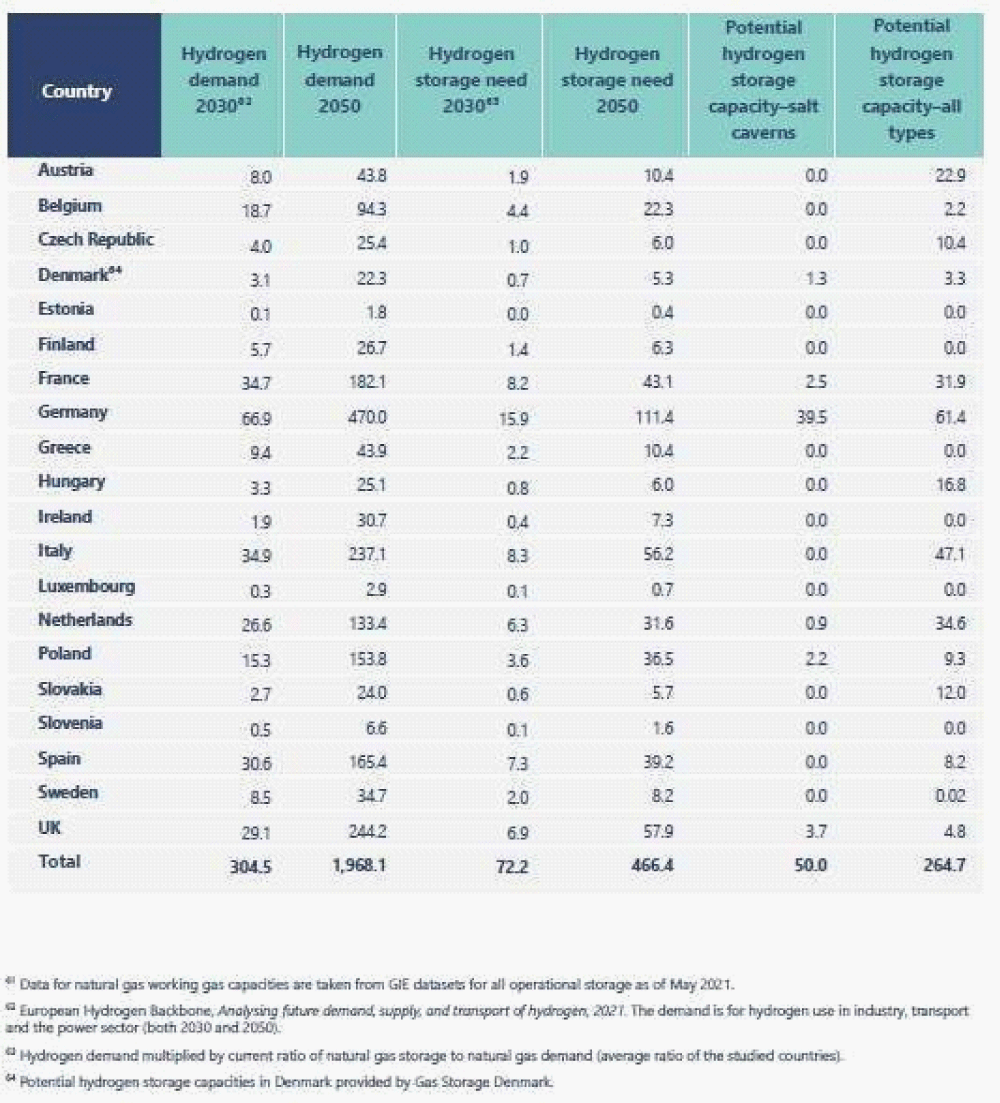
Figure 43: Hydrogen storage capacities in the EU. https://www.gie.eu/press/gie-new-study-picturing-the-value-of-underground-gas-storage-to-the-euh2-system/
Germany stores approximately. 155 TWh of working gas in salt caverns. Considering that hydrogen has a significantly lower density than methane, meaning higher volumes of hydrogen are required to store the same amount of energy as natural gas. Hydrogen energy density at 50°C and 100 bar is roughly 20% that of natural gas. This means the demand of 50 TWh for hydrogen would require about double the volumes of today’s German cavern storages.
This explains that repurposing or refitting existing storages is not only economically advantageous but moreover socially and ecologically far more acceptable than new builds.
With excellent and well-integrated transport infrastructure Germany could serve as a major hub a larger European hydrogen market (Figure 44).
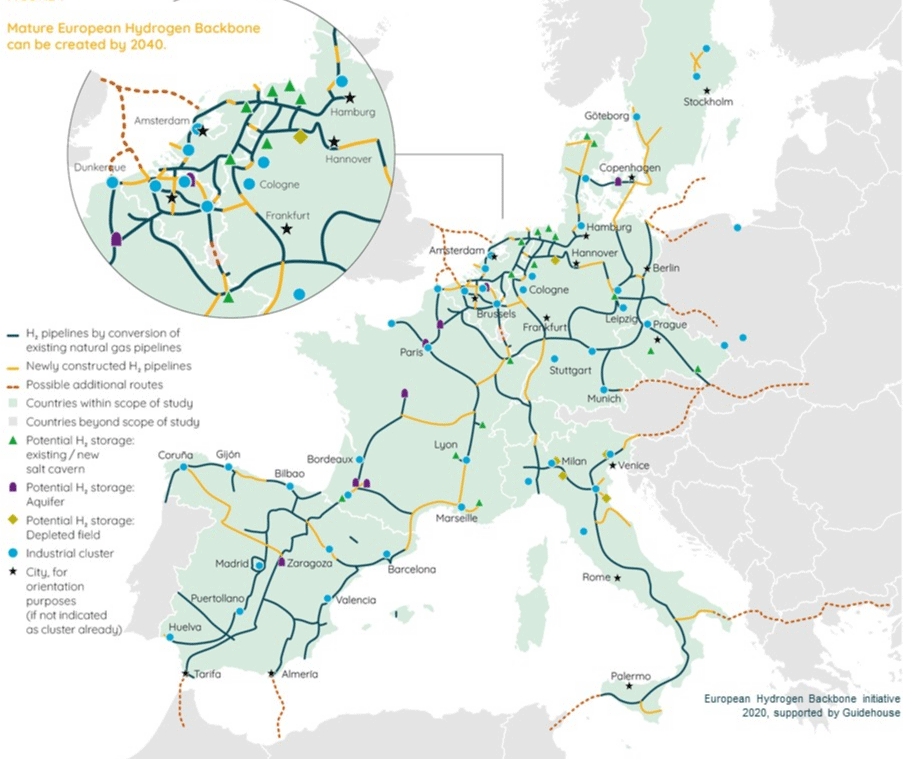
Figure 44: Source = 2022 European Hydrogen Backbone (dashed lines = under work). Source = 2022 European Hydrogen Backbone (dashed lines = under work), EHB European Transport Pipelines
In summary: National politics and the EU Commission have to ensure in their drafting of regulations and settings of market rules, that the existing gas infrastructure will be considered a backbone for the future sector coupling and the consequences will have significant economic impacts.
If coal and oil shall be displaced sooner natural gas due it´s excellent infrastructure becomes integral part of Europe future energy infrastructure. As one of the guiding principles the climate neutrality must also be financially and socially acceptable.
Therefore it´s now the time to set the direction in order to maintain and develop Europe’s gas infrastructure which can accelerate the energy transmission with the development of a pan European hydrogen market.
Between 2030 and 2040, the European Hydrogen Backbone will continue to grow, covering more regions and developing new interconnections across Member States. Driven by the ambitious policy environment set in the Green Deal, Fit for 55, and REPowerEU proposals, an increased urgency to meet climate targets, and a rapidly increasing number of projects and initiatives supported by public authorities and industry, the supply corridors will naturally extend into areas where cost-effective pipeline transport of hydrogen is needed to meet market demands.
As large supply corridors come together, a core European Hydrogen Backbone can be envisaged by 2040. This means that a pan-European hydrogen infrastructure can be created connecting 28 European countries, as shown in Figure 3. By 2040, the proposed backbone can have a total length of almost 53,000 kilometres¹⁸, consisting of approximately 60% repurposed existing infrastructure and 40% of new hydrogen pipelines. Assuming that the backbone is equipped with a fit for purpose and technically robust compression system, the proposed network could be able to adequately meet the foreseen 1,640 TWh of annual hydrogen demand in Europe by 2040.¹⁹
Whereas initially the hydrogen backbone mainly serves industrial hydrogen demand, between 2030 and 2040 hydrogen will increasingly become a significant energy carrier in other sectors, including heavy transport, e-fuel production, the building sector, and long-duration energy storage and dispatched power generation, thereby complementing the electricity grid to integrate large volumes of RES in the energy system. Hydrogen imports via connections from export regions such as Namibia, Chile, Australia and the Middle East, and hydrogen import terminals are expected to replace existing natural gas imports and will make up a material portion of future hydrogen volumes (Figure 45).
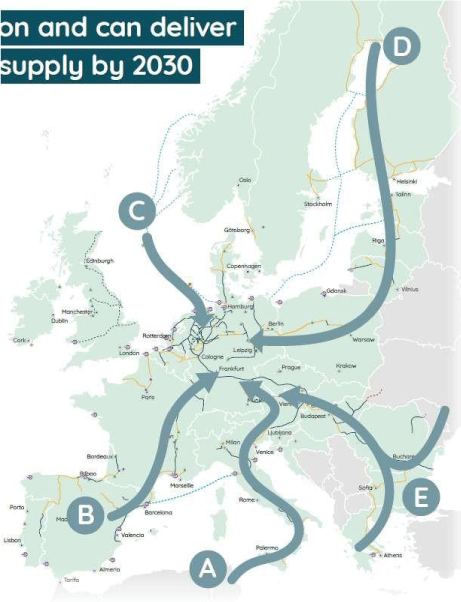
Figure 45: EHB European Transport Pipelines. Source = 2022 European Hydrogen Backbone (dashed lines = under work), EHB European Transport Pipelines
EHB is an initiative of 31 European gas TSOs - incl. Norway, Switzerland and UK - analyzed and studied five large scale, hydrogen supply: corridors that will be critical in transporting the required amounts of hydrogen.
Ultimately, to realize the hydrogen pipeline infrastructure required by 2030, action is needed now.
These five supply corridors have the potential to provide Europe with access to abundant and low-cost hydrogen supply by 2030 (Figure 46).
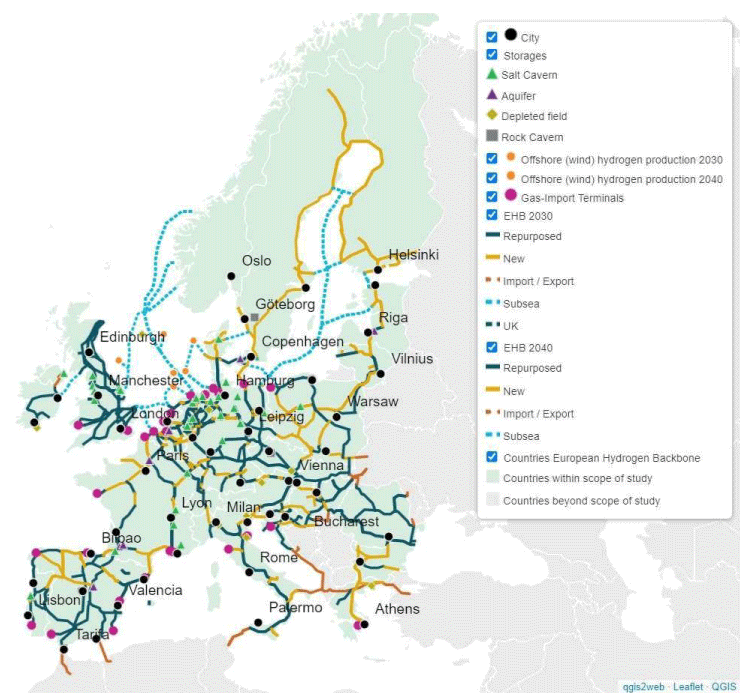
Figure 46: EHB planning of hydrogen pipelines and storage in the EU. https://ehb.eu/files/downloads/EHB-Supply-corridor-presentation-Full-version.pdf
- Worldometer. World Population [Internet]. 2025. Available from: https://www.worldometers.info/population/
- Oak Ridge National Laboratory. Advances in extracting uranium from seawater announced in special issue [Internet]. Oak Ridge, TN: ORNL; 2016. Available from: https://www.ornl.gov/news/advances-extracting-uranium-seawater-announced-special-issue
- World Nuclear Association. Radioactive Waste – Myths and Realities [Internet]. London: World Nuclear Association; 2022. Available from: https://world-nuclear.org/information-library/nuclear-fuel-cycle/nuclear-waste/radioactive-wastes-myths-and-realities
- H2Pro. H2Pro targets tonne-per-day scale renewable hydrogen capability by 2030 [Internet]. Ammonia Energy Association; 2022. Available from: https://ammoniaenergy.org/articles/h2pro-targets-tonne-per-day-scale-renewable-hydrogen-capability-by-2030/
- Ocko IB, Hamburg SP. Climate consequences of hydrogen emissions. Atmos Chem Phys [Internet]. 2022;22(15):9349–68. Available from: https://doi.org/10.5194/acp-22-9349-2022