
More Information
Submitted: May 19, 2026 | Accepted: May 30, 2026 | Published: June 01, 2026
Citation: Krowne CM. Superconductivity Use for Redox Flow Batteries. Int J Phys Res Appl. 2026; 9(6): 145-161. Available from:
https://dx.doi.org/10.29328/journal.ijpra.1001154
DOI: 10.29328/journal.ijpra.1001154
Copyright license: © 2026 Krowne CM. This is an open access article distributed under the Creative Commons Attribution License, which permits unrestricted use, distribution, and reproduction in any medium, provided the original work is properly cited.

Superconductivity Use for Redox Flow Batteries
Clifford M Krowne*
Chief Research Scientific Officer, Ashlawn Energy, LLC, 710 Resende Road, Bldg. 199, Webster, New York 14580, USA
*Address for Correspondence: Clifford M Krowne, Materials Physics & Chemistry Section, Materials and Sensors Branches, Material Science & Technology Division, & Microwave Circuits & Electromagnetic Theory Sections, Microwave Technology & Electromagnetics Branches; Electronics Science & Technology Division, Naval Research Laboratory, 4555 Overlook Avenue, SW, Washington, DC 20375, USA, Email: [email protected]
In the past, our company has investigated many aspects of Redox Flow Batteries (RFBs) in order to advance understanding of the basic science and engineering, which would impact our efforts to manufacture Vanadium Redox Flow Batteries (VRFBs). This has included: quantum chemistry origin of the exponential unitless coefficients found in Taflove and Butler-Volmer equations allowing closed form nonlinear current-voltage analytical formulas [1]; Nernst equations showing dependence on overpotential in nonequilibrium [2,3]; governing equations required to describe the operation of a redox flow battery [4]; the role of fluid physics controlling the VRFB including ion crossover effects [5,6]; optical techniques involving spectroscopy to assess ion concentrations [7]; various measures of RFB performance such as Coulomb, voltage and energy efficiencies, and energy density [8]; State of Charge (SoC) contributions in bipolar plates and electrodes [9]; and charging requirements for starting up and maintaining cycling through time of the RFB [10]. An overview of using RFBs for residential, commercial, or medical facilities was provided too [11]. The last articles [10,11] hint at the best ways to go from the RFB system (stack, tanks, sensors, pumps, pipes, and monitoring computers) to the power grid.
The treatment in this paper aims to fill in a gap that has existed in the literature for many decades, which is whether or not to use AC or DC power grid lines and whether or not to use conventional aluminum/copper or other conventional metals, or to use superconducting lines, to feed into the RFB. The use of superconducting lines is known to allow the movement of power at a considerable reduction in losses (usually ohmic) compared to conventional metal lines. It would seem this would be the best alternative for feeding power to end users, such as those employing RFBs to store energy and providing power during power outages. The problem with that thought is that there is a considerable cost to providing the cooling systems required to lower the power line grid temperature Tgrid below ambient temperature Ta enough that it is also less than the superconducting critical temperature TC. That is,
Well known is the advantage of using AC transmission along power lines because the losses are considerably less than those of DC transmission, especially for long distances. This truth does not hold for shorter grid movements, however. For shorter power distance transmission, the use of either AC or DC would be acceptable. For shorter distances, it might very well be viable economically to employ Superconducting (SC) lines. This would be helped enormously if the SC line materials had TC's higher than the readily available material TC's, which are below 140 K, with commercially available materials with considerably lower TC's. Note that room temperature is at about 300 K. There is another caveat, and that is the use of AC power transmission using SC lines induces eddy currents with flow increasingly restricted to outer conducting SC surfaces as frequency increases. This problem does not occur for DC SC transmission. Figure 1 shows the two types of power transmission grids (AC and DC), and the required transformations from that grid's high voltage to the low voltage (but often high amperage of the redox flow battery stack) - at the bottom of each flow chart is found the VRFB. Figure 2 shows one of our stacks, which is contained in the last block diagram at the bottom of each flow chart. Figure 3 shows what a single-cell VRFB looks like internally regarding the electrochemistry, as well as the external equipment to run it.
The literature in the field of superconductivity is vast, and includes many efforts over the last nearly 40 years, earlier directed toward developing higher Tc materials beyond the first wave of those that shot up beyond the more traditional spherical band structures. Now the superconductive community knows about iron-based superconductors (pnictides, like Fe-doped LaOFeAs [12-14]), which can display a relatively high Tc. There are also more exotic superconductors, which can not advertise for high Tc applications. Rather, they are of interest ever since investigations into 2D materials showed that graphene layers of a single material have analogous properties to Dirac particles associated with studies in particle physics. What I am talking about here are graphene bilayers, which have the two layers slightly twisted with respect to their atomic lattice arrangement [15-17]. Of course, there are the more traditional low critical temperature materials, which are mostly pure metals like Hg or Pb, or alloys like niobium-titanium, germanium-niobium, or niobium nitride. Beyond the cuprate ceramic high Tc materials, there are others like magnesium diboride [18,19] with a Tc = 39 K. Under enormous pressure (90 GPa), H2S has the highest Tc ever recorded at 203 K [20,21]. The Yttrium Barium Copper Oxide (YBCO) family of crystalline compounds has general formulas of , with original Tc found to be 93 K [22]. This group of various stoichiometry oxides can be seen as part of the more general group labeled as ReBCO, with Re = rare earth element. Non-rare-earth high Tc superconductors were also found [23-28].
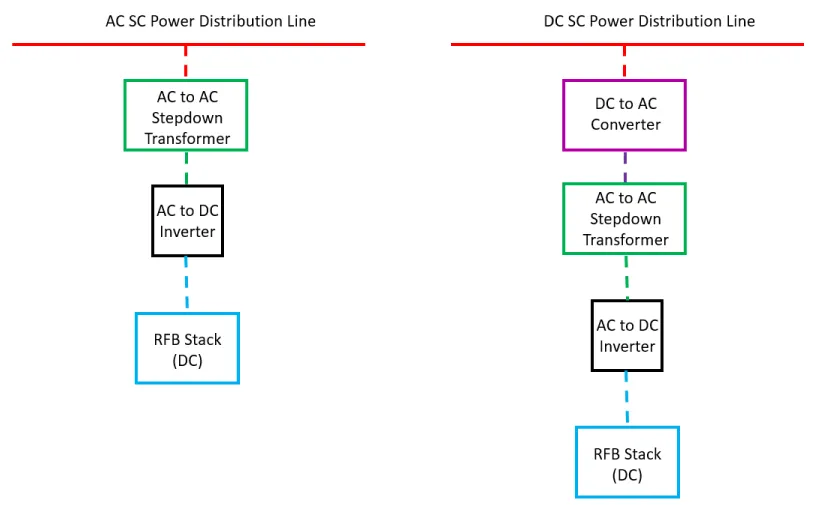
Figure 1: Power distribution grid types (AC SC line left-hand diagram; DC SC line right-hand diagram), with the required transformations needed to reach the redox flow battery stack.
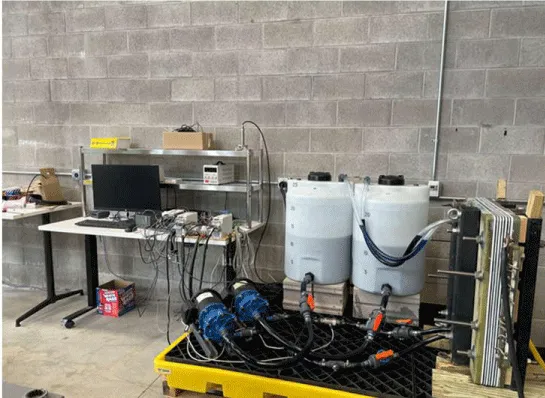
Figure 2: Shown is an assembled Ashlawn 3-cell medium-sized vanadium redox flow battery stack, with electrolyte tanks and pumps for the negative and positive battery half-cells, with a computer for monitoring the stack (on the bench in the left-hand background). Controls for adjusting pump speeds are shown on the bench with the computer. Spill berm (black lattice insulating structure inserted into the yellow tub) for fluid containment is shown below the tanks, pumps, and stack. (Taken from [10].)
Sections that follow treat: quantum wave nature of the superconducting electrons (Section II); quantum wavefunction pairing overlap in the 3D lattice (Section III); orbital spatial characteristics (Section IV); relationship between energy interaction mechanisms and the critical superconducting temperature (Section V); trends of the superconducting materials about atomic or molecular mass, unit cell volume or atom counts (Section VI); a discussion (Section VII), and conclusions (Section VIII) (Figure 3).
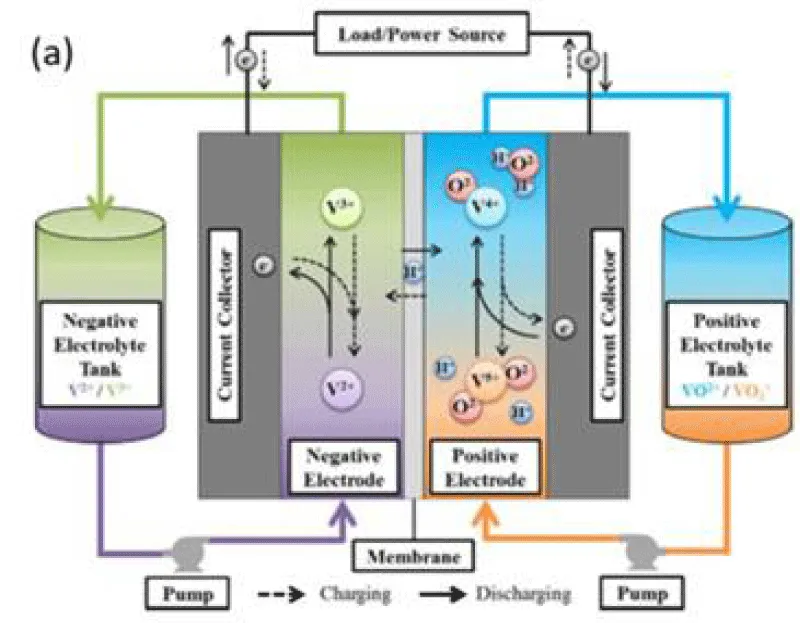
Figure 3: Shown is a single-cell VRFB, showing the internal stack chemistry and the external equipment to run that stack. This is a cross-sectional view. (Taken from [10].)
It is well understood that the electrons must pair up in twos to combine a spin-up electron with a spin-down electron, so that the combination has no net spin. When the electrons doing this share a common space, traveling together, one calls them Cooper pairs. Therefore, the basic unit of charge for superconductivity is 2e-, where e- is the magnitude of the electron. An equivalent statement to saying the Cooper pair has no net spin is to say that their combined magnetic moment is zero. When such a pair presents itself to other electrons, there is no tendency to break up motion due to Faraday effects. However, there is still a net charge, albeit now 2e-, which presents itself to other electron pairs. This repulsive phenomenon will be dealt with later.
Often, one refers to superconductors as s-wave or d-wave, based on the orbital nature of the electron involved. Orbitals are determined by the various atomic constituents of the compound superconductor. Generally, one may also have p-wave or even f-wave superconductors. The direction of the wave may be forward or backward propagating, depending on the sign of the momentum vector q. For the s-wave electron, for its lowering (or destruction operator), one has
(1)
Notice that the destruction operator is given in reciprocal momentum space. The only way for this electron to pair up with another electron in a common quantum space is for its momentum to be exactly opposite and equal in magnitude to the other electron’s momentum. Thus,
(2)
For all electron waves, the prefactor retains the fermion character of the operator, whereas the exponential factor stores the explicitly propagating wave nature for the quantized particles of motion.
Momentum and spin for the s-electrons must satisfy
(3a)
(3b)
We see from (3) that both momentum and spin are three-dimensional vectors.
Suppose that one considers p-wave superconductors. Then the quantum wave expressions become
(4)
(5)
Momentum and spin for the p-electrons must satisfy
(6a)
(6b)
What about the cuprate superconductors, with d-wave character? Then
(7)
(8)
Momentum and spin for the d-electrons must satisfy
(9a)
(9b)
But why look at the d-orbital as the last possible orbital to consider? At least the f-orbital could be in play to provide electrons. Let’s add the f-orbital to our list and then obtain
(10)
(11)
Momentum and spin for the f-electrons must satisfy
(12a)
(12b)
Alright, so one has amassed a collection of possible orbital contributing electrons. Is this all to it? The answer is a resounding no! That is because, in principle, the two contributing electrons may arise from different orbitals. Available orbitals are the s-, p-, d-, and f-orbitals. As long as there is orbital electron quantum wavefunction overlap in 3D space, pairing could, in principle, occur. Thus, there is both self-orbital pairing, as well as inter-orbital pairing. How many combinations Corbitals are there for inter-orbital pairing? Consider there being two slots available. The first slot can take any one of 4 orbitals. The second slot has three remaining possibilities. However, the order in which the slots are filled is immaterial, as one is only counting pairs, not the order in which one made the pairs. The answer is
(13)
So, is there a convenient way to express the association of any two orbital possibilities, regardless of whether they are intra-orbital or inter-orbital? The answer is yes, letting the two indices i and j be set to
(14)
One. Then the quantum wave expressions become
(15)
(16)
Momentum and spin for the p-electrons must satisfy
(17a)
(17b)
Is one now done? The answer again is no. That is because, generally, one does not have a solid-state superconducting material that is made up of pure single atoms for high critical superconducting temperatures. Originally, superconductivity was found in pure metals, like mercury, tin, lead, thallium (Tl), niobium (Nb), aluminum (Al), and technetium (Tc). These metals, and others (see Table 1), are referred to as Type I superconductors.
| Table 1: Elemental superconductors, with their critical superconducting temperatures Tc (K) and critical magnetic fields Hc (T). All are BCS-type SCs except Bi, Li, Rh, β-W, and Yb. | |||
| Element | Tc (K) | <Hc (T) | Type (I or II) |
| Al | 1.20 | 0.01 | I |
| Bi | 5.3 ´ 10-4 | 5.2 ´ 10-6 | I |
| Cd | 0.52 | 0.0028 | I |
| Ga | 1.083 | 0.0058 | I |
| Hf | 0.165 | I | |
| α-Hg | 4.15 | 0.04 | I |
| β-Hg | 3.95 | 0.04 | I |
| In | 3.4 | 0.03 | I |
| Ir | 0.14 | 0.0016 | I |
| α-La | 4.9 | I | |
| β-La | 6.3 | I | |
| Li | 4.0 ´ 10-4 | I | |
| Mo | 0.92 | 0.0096 | I |
| Nb | 9.26 | 0.82 | II |
| Os | 0.65 | 0.007 | I |
| Pa | 1.4 | I | |
| Pb | 7.19 | 0.08 | I |
| Re | 2.4 | 0.03 | I |
| Rh | 3.25 ´ 10-4 | 4.9 ´ 10-6 | I |
| Ru | 0.49 | 0.005 | I |
| Sn | 3.72 | 0.03 | I |
| Ta | 4.48 | 0.09 | I |
| Tc | 7.46 – 11.2 | 0.04 | II |
| α-Th | 1.37 | 0.013 | I |
| Ti | 0.39 | 0.01 | I |
| Tl | 2.39 | 0.02 | I |
| α-U | 0.68 | I | |
| β-U | 1.8 | I | |
| V | 5.03 | 1.0 | II |
| α-W | 0.015 | 0.00012 | I |
| β-W | 1 - 4 | ||
| Zn | 0.855 | 0.005 | I |
| Zr | 0.55 | 0.014 | I |
When these Type I superconductors are cooled below their critical temperature, they expel all magnetic fields from their interior, a phenomenon known as the Meissner effect. They behave like diamagnets. Superconductivity stops once the applied magnetic field exceeds its critical magnetic field, and the material returns to a normal, resistive state. The critical field for a Type I superconductor is temperature-dependent and can be described by the equation:
(18)
Figure 4 demonstrates this quadratic expression for a Type I superconductor, and shows the contrasting case for a Type II superconductor, which possesses vortices of magnetic flux penetrating parts of the superconducting material when
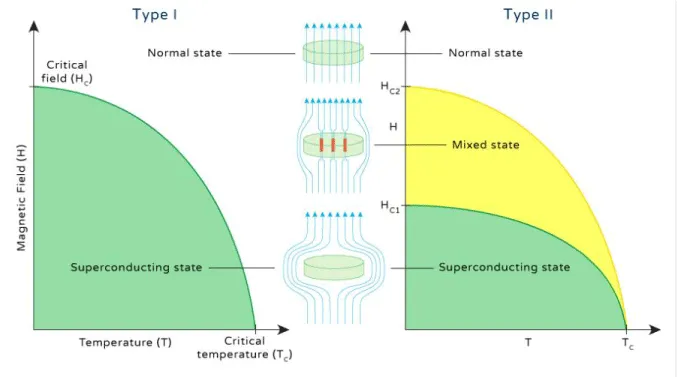
Figure 4: Type I (left diagram) and Type II (right diagram) superconductors, showing magnetic field H vs T.
(19)
Type-I superconductors are pure metals with low critical temperatures, exhibiting perfect Meissner effect (complete field expulsion) and a sharp transition to normal state at a single critical field, making them "soft"; Type-II superconductors, often alloys or ceramics, have two critical fields, a "mixed state" (vortices of magnetic flux) between them, and can withstand much higher fields, making them "hard" and practical for strong electromagnets like MRI machines.
Let us think about these Type I superconductors, as to their orbital nature. Atomic orbitals have their electron wavefunctions overlapping in 3D real space, with contributions at any spatial location depending on the quantum probability or wavefunction to be at that location. Atoms in a perfect lattice of the elemental material consist of a repetitive pattern in 3D space. Orbital electron overlap for a pair depends on contributions from nearest neighbor atoms, next nearest neighbor atoms, and so on, moving through the 3D lattice. This does not preclude both electrons coming from the atom itself, if it possesses two or more electrons. Let’s examine the highest TC elemental superconductors from Table 1: Tc, Nb, and Pb. Their electron configurations are: Tc: [Kr] 4d5 5s2; Nb: [Kr] 4d4 5s1; Pb: [Xe] 4f14 5d10 6s2 6p2. Therefore, Tc and Pb can get both paired electrons from the same atomic orbitals (respectively, the s- and p-orbitals) in the lattice, whereas Nb must find the second s-orbital electron from another atom in the lattice. Knowledge that the outermost electrons can act as Bloch electrons and cruise the entire lattice freely, guides us into understanding that this may not be much of a problem. But this still points up that even with elemental superconductors, accounting for the 3D lattice becomes relevant.
Pairing is promoted by various energy exchange mechanisms, which allow the Coulomb repulsion of the two electrons to be paired. Therefore, energy must be supplied to push the two electrons into enough proximity to be in mutual association. Call the mechanism energy, which depends on the mechanism type m, electron positionsand. This interaction energy must be weighted by each electron's probability to be present in real space to allow the energy exchange to allow pairing. Electron 1’s wavefunction is , whereas the second electron’s wavefunction is . Orbital type is for the first electron, and for the second electron. Electron orbitals arise from different lattice atoms, of type a1 for the first electron and a2 for the second electron. The total electron wavefunction for the first electron arises from summing over the entire lattice, perhaps in a tight-binding approximation. Therefore,
(19)
Similarly, for the second electron of the pair,
(20)
Equations (19) and (20) are atom-specific orbital electron wave functions. They also contain electron spin information to be complete. This could be put in explicitly, or one can append a spin index, σ, to each wavefunction. The result of the latter is
(21)
(22)
One may readily employ the Bloch theorem (use of this theorem for finding the tight binding electronic structure of 2D hexagonal materials is seen in Krowne, Chapter 3 of Advances in Imaging and Electron Physics, Vol. 210, 2019 [29]) to find the resulting wavefunctions at the various atomic locations, being careful to keep track of each atom location the lattice, where atom, has a1.
(23)
At this point in the discussion, one is at the point of being able to calculate the matrix element of the interaction, the interaction Hamiltonian of the electron pair system. One finds for the mth mechanism,
(23)
Considering all mechanisms,
(24)
One can point out here that examination of the properties of 2D materials has been of great interest recently [30-33], although here examination of more 3D-like SC’s is treated, but one should be aware that 3D or lower-dimensional 2D or thin film SCs are relevant [34-37]. Even 1D materials are of interest, like nanowires, but they are less relevant for SC [38-40].
It would be useful at this point to examine the various orbital spatial distributions and determine which of them are most favorable, if any, for Cooper pair associations. Figure 5 shows the distributions in angular space.
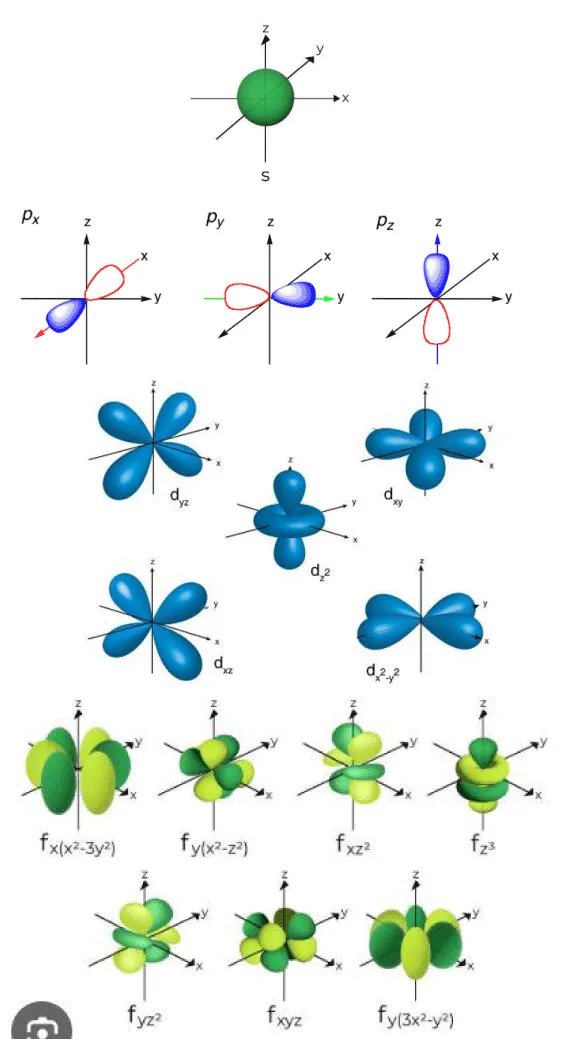
Figure 5: Graphical 3D sketches of the s, p, d, and f electron orbitals for the atomic nucleus, showing the angular distributions.
In an atom, the principal quantum number n describes the energy of an electron and is associated with many orbitals. And n = positive integer. The orbitals associated with a particular n are said to reside within the nth shell. An azimuthal quantum number l characterizes the orbital angular momentum of an electron, is an integer, and The range of l is The last quantum number required to describe electron motion around the nucleus is the magnetic quantum number ml. It represents the projection of the orbital angular momentum along a chosen axis, and determines the magnitude of the circulating electron current about that axis, giving the magnetic moment of that electron. Its range of values is For a given n and value l, the range of ml gives those subshell orbitals.
As is apparent, the larger n is, the more orbitals are found within each l subshell. And this is why one must enter the lanthanum group with n = 4, to get f orbitals.
The wave function describing the above considerations is the well-known form [41]
(25)
Here is the radial part of the wavefunction and is the complex spherical harmonic part of the wavefunction.
The quantum mechanical representation of the complex spherical harmonic is
(26)
Here are the associated Legendre polynomials. Radial quantum mechanical part of the wavefunction satisfies the Schrodinger differential equation
(27)
The Cartesian polynomial representation shown in Table 2 arose as a desirable way to display the complex wavefunction in a real 3D form, by noting that superpositions of wavefunctions can be valid quantum mechanical solutions of the atomic orbital equation. This is while realizing that such superpositions, based upon complex exponential expansions in sinusoidal functions, generate real numbers
| Table 2: Cells showing subshells, allowable for a particular shell, angular momentum quantum number (n, l) set, up to l = 4, n = 5. | |||||
| l = 0 (s) | l = 1 (p) | l = 2 (d) | l = 3 (f) | l = 4 (g) | |
| n=1 | ml = 0 | ||||
| n=2 | 0 | -1, 0, 1 | |||
| n=3 | 0 | -1, 0, 1 | -2, -1, 0, 1, 2 | ||
| n=4 | 0 | -1, 0, 1 | -2, -1, 0, 1, 2 | -3, -2, -1, 0, 1, 2, 3 | |
| n=5 | 0 | -1, 0, 1 | -2, -1, 0, 1, 2 | -3, -2, -1, 0, 1, 2, 3 | -4, -3, -2, -1, 0, 1, 2, 3,4 |
(28)
Inspection of the spherical s electron orbital shows that it is omnidirectional, allowing equal interaction with a quantized wave. Thus, s orbitals are extremely desirable if they are available in the superconductor material being considered. And this is why superconductivity was first discovered and even understood with the first detailed theoretical model, the Bardeen-Cooper-Schrieffer (BCS) model, for both pure elemental metals and compounds. This is also why exposed s orbitals should be very desirable for any higher temperature superconductors. Embedded s orbitals may be shielded by more exterior orbitals, and this would likely reduce their effectiveness in interacting with the propagating nonlocal quantum waves.
The next orbital group is the p electron orbitals. They have no omnidirectional character. Instead, they have coordinated directional preferences. So these are much less desirable for interaction capability with the propagating quantized waves, as they intersect with a much smaller solid angle 3D cross-section. However, as noted by various workers, they may be instrumental in shuttling charges from one part of a unit cell to another, particularly important in many of the complicated cuprate compound superconductors.
Cuprate superconductors have the advantage of d electron orbitals. Their dxy, dxz, dyz orbitals have twice as many lobes as p orbitals, so they will have a much larger solid angle 3D cross-section with which to intersect with the propagating quantized waves. Furthermore, of the other two d orbitals, the adds again for lobes in the xy-plane (with excursions into the z-direction). Finally, the last d orbital, the, has two lobes in the z-direction (like one of the p orbitals), but also an xy-plane omnidirectional lobe which should enhance xy-plane interactions with the propagating quantized waves. One concludes copper is an ideal d orbital atom for superconductivity. Recall that copper has the orbital structure [Ar] 3d10 4s1, which is a remarkable situation. This is because copper atoms have a full d subshell filling, meaning that the maximum number of electrons consistent with the Pauli exclusion principle exists. There are ten times the number of electrons in copper’s d subshell with which to interact with the propagating quantized waves.
So, one wonders if there are possible f orbital electrons available in great numbers to interact with the propagating quantized waves. One does not get to this point in electron occupancy for f orbital atoms until one reaches dysprosium with electron orbital structure [Xe] 4f10 6s2. The f orbitals have 4, 6, or 8 lobes, with one omnidirectional in the xy-plane (the orbital, which has two lobes and two rings, nominally 4 lobes). Six lobed f orbitals are the . Eight lobed f orbitals are the and the . Therefore, one sees that the f orbitals, with their rich lobe structure, provide ample opportunity for a significant solid angle 3D cross-section, with the
The eight lobed, orbitals are particularly effective interaction with the propagating quantized waves. For good interaction in a plane, consider the six lobed f orbitals , which for the first two handle the xy-plane, whereas the other two handle the xz-plane and yz-plane. Finally, the orbital has a mediocre quasi-omnidirectional character.
There is a logarithmic expression that relates the critical temperature TC to the sum of the energy interaction mechanisms involving the electron pairs, with each particular mechanism. It is a sophisticated expression based upon second quantization arguments and renormalization techniques [42,43], and may be stated as
(29)
The way to interpret this expression is that as one adds more energy exchange mechanisms, enlarging the left-hand side of (29), the logarithm of the critical temperature In TC must rise, catching up to the other logarithm in the denominator. The units of the density of states at the Fermi energy, d, are in whereas the unit cell crystal lattice volume is in cc, making the product . Since is in units of Kelvin, the logarithmic difference found in (29) is unitless. Equation (29) may be solved for this logarithmic difference,
(29)
As TC rises, the left-hand-side difference approaches zero, which is the same as saying
(30)
Therefore, one must conclude that Cscaling forms some unattainable upper limit, because there is no physical way the sum of all the energy exchange mechanisms transferring energy between the electron pairs and each mechanism, summed, can be infinite. Thus, one may state the following for the maximum critical superconducting temperature,
(31)
Here Cscaling can be written, if one assumes only one mechanism is responsible for the majority of energy transfer, as
(32)
Here, is the reduced Planck’s constant, and kB is Boltzmann’s constant, given respectively, by and Therefore, the second ratio yields temperature. The first ratio is unitless.
Averages over the mechanism types are given by
(33a)
(33b)
Here are the characteristic mechanism energies, their weights, and the total number of mechanisms.
Consider the upper inequality in (31).
(34)
Convert this to an equality, and substitute in (32).
(35)
Once one decides on a desirable maximum critical superconducting temperature, the averaged mechanism characteristic frequency of the interactions is pinned down. That is,
(36)
Since each alpha factor is on the order of unity,
(37)
Also, the Boltzmann to reduced Planck constant ratio is,
(38)
To convert this expression into something recognizable, it is useful to relate eV to ergs. The conversion is By (36),
(39)
Using the conversion,
(40)
If one sets to be room temperature, namely about 300 K, used (37), then (40) yields
(41)
However, (35) and (41) are not correct for many mechanisms, some contributing equally to the energy exchange. Energy exchange is an additive, not an averaged effect. Therefore, the correct expression is
(42)
Giving
(43)
Equation (43) demonstrates a fundamental property of the energy exchange mechanisms. That they are additive in the renormalization second quantization model, when contributing to the critical superconducting temperature. The more viable mechanisms that can be realized when making a compound superconducting lattice, the higher the possible Thus, one should strive for compound superconducting materials which have as many possible mechanisms as obtainable.
It was long ago recognized that for single-atom, elemental superconductors, the critical temperature seemed to be related to the atomic mass. Let us take a look again at this trend. First note that the isotope effect was confirmed, which showed that if there were several isotopes, the heavier isotopes had higher critical temperatures. This was one of the original confirmations of the Bardeen-Cooper- Shrieffer (BCS) theory of superconductivity. Take eleven elements from Table 1, plotting each of their TC's against atomic weight AW, as shown in Figure 3. The purple line shows the overall trend, which supports the idea that larger AW leads to a higher. But this is only an approximate trend, as there are two outliers, vanadium V and hafnium Hf.
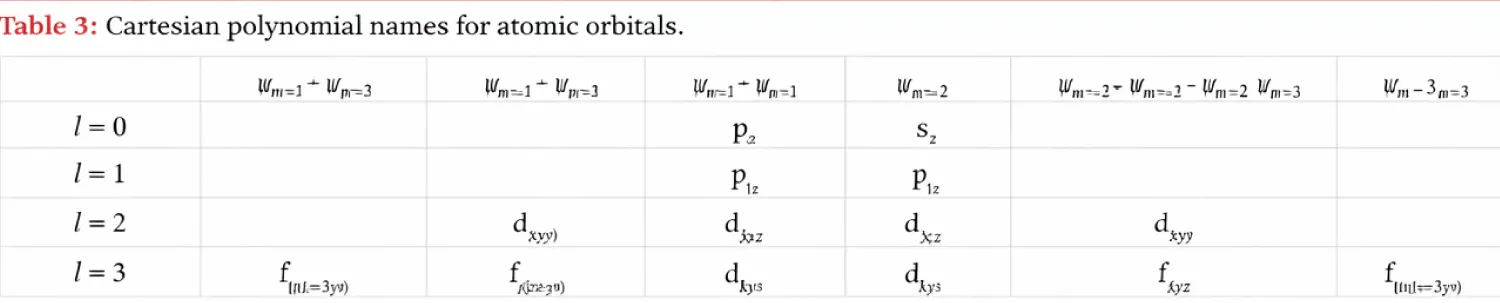
Table 3: Superconducting elemental critical temperature versus elemental atomic weight.
One can also calculate the unit cell volumes of the elemental superconductors plotted in Figure 6. Element lattice constants and their crystal structures are given in Table 4. The volume results are provided in Table 5, after enlisting the following formulas for the unit cell volumes:
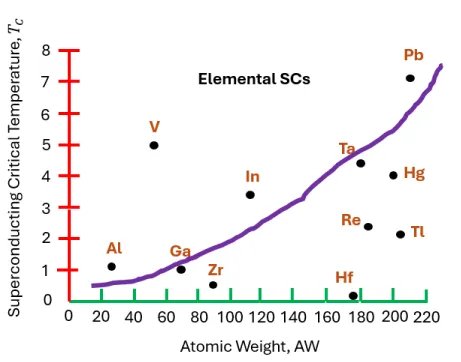
Figure 6: Superconducting elemental critical temperature versus elemental atomic weight.
| Table 4: Elemental superconductors, their crystal structures, and lattice constants. | ||
| Element | Crystal Structure | Lattice Constants (Å) |
| Al, Aluminum | Face-centered cubic | a = 4.0493 |
| Ga, Gallium | Orthorhombic base-centered | a = 4.5205, b = 7.6625, c = 4.5266 |
| Hf, Hafnium | Hexagonal close-packed | a = 3.1942, c = 5.0512 |
| Hg, Mercury | Rhombohedral | a = 3.0106, α = 70.529 |
| In, Indium | Tetragonal body-centered | a = 3.2516, c = 4.9471 |
| Pb, Lead | Face-centered cubic | a = 4.9499 |
| Re, Rhenium | Hexagonal close-packed | a = 2.7610, c = 4.4584 |
| Ta, Tantalum | Cubic body-centered | a = 3.3029 |
| Tl, Thallium | Hexagonal close-packed | a = 3.4566, c = 5.5252 |
| V, Vanadium | Cubic body-centered | a = 3.0272 |
| Zr, Zirconium | Hexagonal close-packed | a = 3.2322, c = 5.1479 |
| Table 5: Elemental superconductors and their unit cell volumes. | |
| Element | Unit cell volume ψm =- 3 + ψm = 3 |
| Al, Aluminum | 66.40 |
| Ga, Gallium | 138.9 |
| Hf, Hafnium | 160.3 |
| Hg, Mercury | 23.49 |
| In, Indium | 52.31 |
| Pb, Lead | 121.2 |
| Re, Rhenium | 88.30 |
| Ta, Tantalum | 36.03 |
| Tl, Thallium | 66.01 |
| V, Vanadium | 27.74 |
| Zr, Zirconium | 139.7 |
(44a)
(44b)
(44c)
(44d)
(44e)
(44f)
The last formula (44f) is not obvious, but it is a result of the rhombohedral geometry of the unit cell. The second-to-last formula for the hexagonal close-packed unit cell arises from finding the area of a single isosceles triangle, then multiplying by the unit cell height.
One can plot the theoretical temperature TC against the unit cell volume, and this is displayed in Figure 7.
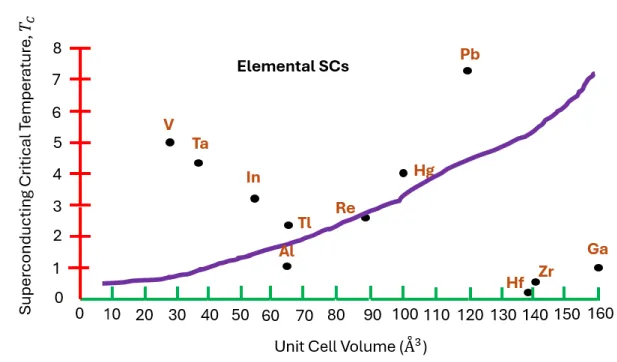
Figure 7: Critical superconducting temperature TC against the unit cell volume given in Å3.
In fact, there is a general trend, with increasing critical temperature as unit cell volume increases. But it is a very rough trend, with several outliers, namely V, Ta above the trend line, and Hf, Zr, and Ga below the trend line.
Nevertheless, these trends for TC against atomic weight AW and against unit cell volume encourage us to do something similar for the higher TC compound superconducting materials. Of course, the original high TC materials were the YBCO [44–47] or ReBCO families (Re = rare-earth element). Cuprate superconductors are a family of high-temperature superconducting materials made of layers of copper oxides CuO2 alternating with layers of other metal oxides, which act as charge reservoirs. Their superconducting properties are determined by electrons moving within weakly coupled copper-oxide CuO2 layers, with neighboring layers containing ions such as La, Ba, Sr, or other atoms that act to stabilize the structures and dope electrons or holes onto the copper-oxide layers. The undoped compounds are known as Mott insulators with long-range antiferromagnetic (AFM) order at sufficiently low temperatures.
There are other high TC materials which are not in the YBCO or ReBCO families. This includes with TC = 133 – 138 K [26]. A superconductor containing both mercury and thallium is Tl1.6Hg0.4Ba2Ca2Cu3O10−δ, which has a TC = 130 K [48]. There are other Hg/Tl superconductors, a 1234 cuprate superconductor, like Cu0.5(Tl0.5−yHgy)Ba2Ca3Cu4O12−δ, which has improved interlayer coupling [49]. Thallium-based SCs without mercury have a lower TC [50,51]. The thallium family of high-temperature superconductors has the general formula Tl2Ba2Can-1 CunO2n+4+x. Generally, TC increases with the number n of CuO2 copper planes, peaking at n = 3. Another group of non-rare earth superconductors is the bismuth-strontium-calcium-copper-oxide family, Bi2Sr2Can-1CunO2n+4+x [52-57], with n = 2 being the most commonly studied family, although n = 1 and n = 3 have also been given attention too. Their Tc’s are 107 – 160 K.
Cuprate superconductors are copper-oxide-based ceramic materials known for having the highest superconducting transition temperatures (TC) at ambient pressure. The highest TC values are generally found in materials with three or more copper-oxide (CuO2) layers per unit cell.
Here are some of the most prominent cuprate superconductors with very high TC:
1. Mercury-Based Cuprates (Hg-series)
These are considered the highest TC materials at ambient pressure.
HgBa2Ca2Cu3O 8+δ :(Hg-1223): Currently holds the record for highest TC at ambient pressure, with Tc≈134 K [26]. Under high pressure, this can increase to 164 K, which one wishes to avoid when trying to operate at standard conditions. Here δ indicates non-stoichiometric oxygen, which is essential to provide the necessary "holes" for superconductivity. It has a tetragonal crystal structure, [58,59]. Its unit cell volume is
(45a)
(45b)
HgBa2CaCu2O6 (Hg-1212): TC ≈128 K [60].
HgBa2CuO4 (Hg-1201): TC ≈94 K [61].
2. Thallium-Based Cuprates (Tl-series)
Tl2Ba2Ca2Cu3O10 (Tl-2223): TC ≈125 K [62].
It has a face-centered tetragonal crystal structure , Its unit cell volume is
(46a)
(46b)
TlBa2Ca3Cu4O11 (Tl-1234): TC ≈122 K [63]. The structure is tetragonal, with four CuO2 layers, with lattice constants a = 3.85 Å and c = 19.1 Å.
Tl2Ba2CaCu2O8 (Tl-2212): TC ≈108 K.
3. Bismuth-Based Cuprates (BSCCO)
Bi2Sr2Ca2Cu3O10 (Bi-2223): TC ≈110 K [64].
It has a body-centered tetragonal crystal structure, Its unit cell volume is
(47a)
(47b)
Bi2Sr2CaCu2O8 (Bi-2212): TC ≈85 K [65-70].
4. Rare-Earth Barium Copper Oxides (ReBCO)
YBa2Cu3O7 (YBCO): TC ≈92 K. This was the first material found to superconduct above the liquid nitrogen temperature (77 K), with the rare-earth element being Re = Y. It has an orthorhombic crystal structure, [71]. When the oxygen content changes, that is the doping to induce either holes or electrons as the conducting carriers, by changing O7 to O7-δ with δ > 0.6, which makes a shortage of oxygen, and a small positive pool of carriers (holes), then the crystal structure changes from orthorhombic to tetragonal. Its unit cell volume will be
(48a)
(48b)
Critical superconducting temperature versus unit cell volume can be plotted, and is shown in Figure 8, using the equation results seen in (45a), (46a), (47a), and (48a).
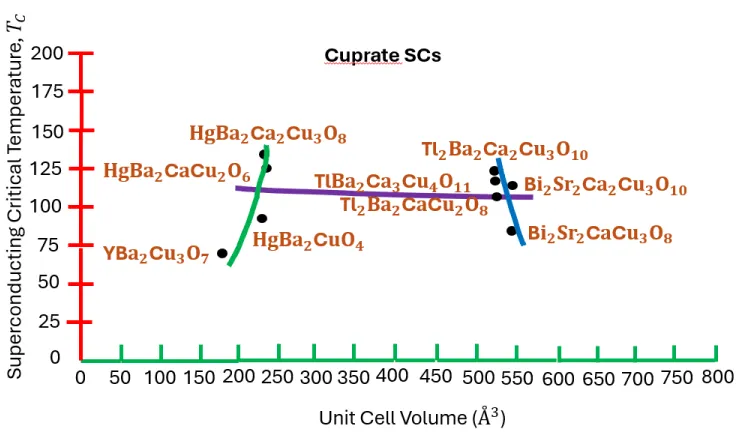
Figure 8: Cuprate superconductors giving TC vs. unit cell volume (Å^3). Shown are mercury-, thallium-, bismuth-, and rare-earth- based compounds.
One concludes from inspection of Figure 5 (look at the purple curve) that there is no marked association between TC and increasing unit cell volume. However, there is a trend (green curve) for the rare-earth and mercury-based superconductors to have increasing TC with increasing unit cell volume. For thallium and bismuth-based superconductors, there is a reverse trend for decreasing TC with increasing unit cell volume. These two counter trends are what generate the lack of any general apparent trend.
Iron pnictides have relatively high too. And they are thought to give a perspective on non-BCS mechanisms, so they have been extensively investigated. Figure 9 provides the unit cell crystal structure of 1111-type ferropnictide.
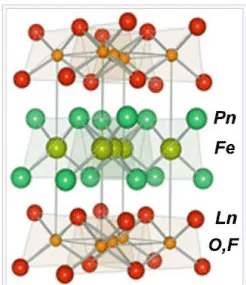
Figure 9: Crystal unit cell structure of a LnFeAsOF class of 1111-type of ferro-pnictides, where Ln = a lanthanide series element, Ln = La, Ce, Pr, Nd, Pm, Sm, Eu, Gd, Tb, Dy, Ho, Er, Tm, Yb, Lu. Pnictide elements are Pn = N, P, As, Sb, Bi, Mc [77].
Iron-based superconductors of the group of oxypnictides were initially called ferropnictides. The crystal structure of these compounds displays conducting layers of iron and a pnictogen (typically arsenic (As) and phosphorus (P)) separated by a charge-reservoir block [8]. It has also been found that some iron chalcogens and crystallogens superconduct.
Iron-based superconductors are classified according to their crystal structure and chemical formula into the following main families,
A. 1111-type, with representative compounds LaFePO, LaFeAsO, SmFeAsO, PrFeAsO, and LaFeSiH
Let’s find the unit cell volume of LaFePO [72-76]. Its crystallographic dimensions are for its tetragonal structure with alternating layers of La-O and Fe-P stacked along the c-axis. Bond lengths are and
(49a)
(49b)
Its TC = 4 - 7 K.
For LaFeAsO, it is not superconducting, has AFM ordering, and is a semimetal. But doping with fluorine, or hydrogen, changes that [77-85]. For LaFeAsO1-x Fx, and x = 0.1, it has TC ≈26 K and a single domed behavior with the AFM ordering suppressed. For LaFeAsO1-x Hx. It has TC ≈36.5 K. Lattice parameters are . Therefore, its unit cell volume is
(50a)
(50b)
There are two superconducting domes are seen with H doping, an x range of 0.08 < x < 0.1. For a TC versus x doping plot, first dome occurs at 0.08 < x < 0.1 with TC ≈26 - 29 K, and second dome occurs at 0.3 < x < 0.35 with TC ≈ 36 - 37 K. What is happening here is that the H anion H- replaces the O anion O2-, releasing an electron for conductivity (of course, pairing is required in actual superconductive transport since the basic unit of charge for superconductivity is 2e-).
For SmFeAsO, the key is to dope with either fluorine or hydrogen atoms [86,87]. For using F doping, the highest TC = 55 K occurs for SmFeAsO0.8F0.2. (Note that NdFeAsO1-xFx has also been found to have a similar TC .) It has unit cell dimensions of .
(51a)
(51b)
Using hydrogen doping, SmFeAsO1-xHx, TC = 55 - 58 K, where Lattice parameters are
(52a)
(52b)
What is special about these 1111-type superconductors is that they have high upper critical fields exceeding 100 T.
For PrFeAsO, superconductivity results from doping, suppressing the AFM spin density wave (SDW) [88–94]. Its lattice dimensions are a = b = 3.98 Å, c = 8.65 Å. Its unit cell volume is
(53a)
(53b)
Under doped PrFeAsO using F doping to reduce O atoms yields PrFeAsO0.7F0.3 and a TC = 25.2 K. Reducing O content slightly and reducing F further to cause an atom imbalance gives PrFeAsO0.65F0.15 with TC = 47 - 52 K. An interesting observation is that replacing the La atom (radius 1.87 Å) with the smaller radius Pr atom (radius 1.82 Å), induces a sort of “chemical pressure” due to the 2.7 % radaii reduction.
For LaFeSiH [95-99], lattice dimensions are a = b = 4.027 Å, c = 8.037 Å. Its unit cell volume is
(54a)
(54b)
Its iron-silicon atom height separation is And its TC = 10 K.
B. 111-type such as LiFeAs, NaFeAs, and LiFeP.
LiFeAs has a TC = 18 K, tetragonal crystal structure, with lattice dimensions of a = b = 3.7914 Å, c = 6.364 Å [100,101], with multiple nodeless superconducting (SC) gaps with 2𝛥/𝑘BTC ratios varying from 2.8 to 6.4, depending on the Fermi surface (FS) [102]. The superfluid density ps (𝑇)=λ2(0)/λ2(𝑇) is well described by the self-consistent two-gap 𝛾 model [103]. Its 3D electronic has been examined [104]. Using density functional theory (DFT) and functional renormalization group method, the superconducting order parameter is found to be of s+- type driven by collinear antiferromagnetic fluctuations, with the parent compound displaying no magnetic order, but superconductivity [105]. Superconducting pnictides are widely found to feature spin-singlet pairing in the vicinity of an antiferromagnetic phase; however, in LiFeAs, a study shows antiferromagnetic order to be absent and almost ferromagnetic fluctuations, which drive an instability toward spin-triplet 𝑝-wave superconductivity [106]. However, the system can be tuned toward a spin-density-wave (SDW) quantum-critical point, showing that LiFeAs is a strongly correlated system and its superconductivity is likely from the SDW fluctuations [106]. Its unit cell volume will then be
(55a)
(55b)
For NaFeAs, its TC = 4 - 25 K, tetragonal crystal structure, with lattice dimensions of a = b = 3.947 Å, c = 6.991 Å. It typically exhibits a tetragonal-to-orthorhombic phase transition and a collinear antiferromagnetic (SDW) transition ( ), and coexistence of superconductivity and magnetic ordering [107]. It was found in another study that this compound is found to undergo three successive phase transitions at around 52, 41, and 23 K, which correspond to structural, magnetic, and superconducting transitions, respectively, and the Hall effect indicates an energy gap at low temperature due to the occurrence of spin-density-wave instability, giving direct experimental evidence of the magnetic ordering in the nearly stoichiometric NaFeAs [108]. Angle-resolved photoemission spectroscopy (ARPES) is used to study twinned and detwinned iron pnictide compound NaFeAs, with distinct signatures of electronic reconstruction (orbital anisotropy in dxy and dyz bands), and observed to occur at the structural (TS) and magnetic (TSDW) transitions, with implications for observance of nematic electronic phase in iron pnictides [109]. Another ARPES study looked at kz band dispersions and orbital [110]. 3D electronic structure of the nematic and antiferromagnetic phases of NaFeAs has been investigated [111], as well as electron nematicity and unidirectional antiferroic fluctuations [112]. Numerical LDA+DMFT calculations compared with ARPES data show that effective mass renormalization near the Fermi level is of order m*/3, due to Fe 3d orbital correlation effects without boson mode effects [113]. Its unit cell volume will then be
(56a)
(56b)
For LiFeP, its TC = 4 - 25 K, tetragonal crystal structure, with lattice dimensions of a = b = 3.692 Å, c = 6.031 Å. Original discovery, see [114]. There is a change in the topology of the Fermi surface where a hole pocket with Fe orbital character changes its geometry from a closed shape in the local-density approximation to an open shape upon inclusion of correlations - low TC and the nodal gap observed in these materials relates this [115]. The discontinuity in the specific heat 𝛥𝐶 at TC violates the global trend in 𝛥𝐶/TC with TC [116]. Using DFT to obtain electronic DOS, overlapping of bands near the Fermi level (3s P state far below EF, 3d Fe state near EF, and Li above EF) shows the metallic nature of LiFeP [117]. Its unit cell volume will then be
(57a)
(57b)
C. 11-type FeSe
A key observation is that the clean superconducting phase for FeSE exists only in those samples prepared with intentional Se deficiency [118,119]. It shows a spin-density wave (SDW) ground state [120]. This superconductor has a TC = 8 - 9 K, tetragonal crystal structure, with lattice dimensions of . Its unit cell volume will then be
(58a)
(58b)
The binary compound FeSe has the ability to reach a TC over 65 K in monolayer films on substrates like SrTiO3. This may be of more than passing interest if there were a way to use this fact by fabricating stacked binary SC-perovskite sandwiches into conducting wires for grid power movement.
D. 122-type such as BaFe2As2, SrFe2As2 and CaFe2As2
BaFe2As2 does not display superconductivity in its pure form, but only with a fourth elemental doping, such as K atom doping to generate holes, giving Ba1-xKxFe2As2 with a TC = 38 K for x = 0.4 [121], or Co atom doping generating electrons, yielding BaFe2-x CoxAs2 with a TC = 22 K for x = 0.2 [122]. Density functional theory (DFT) calculations have been performed on this material [123]. Achieving high critical current densities JC can be attained by removing nano-cracks at grain boundaries [124]. Nix doping has also been done, giving BaFe2-x NixAs2 with a maximum of 20.5 K at x = 0.096 [125]. Annealing can raise TC [126]. Lattice parameters are a = b = 3.96 Å, c = 13.01 Å.
(59a)
(59b)
SrFe2As2 also does not yield superconductivity in its pure form, but only with a fourth elemental doping, such as K atom doping (x = 0.4) to generate holes or seen even higher doping x = 0.5 – 0.6 for K or Cs doping [127], [128], giving Sr1-xKxFe2As2x with a TC = 37 - 38 K, or Co atom doping (x = 0.2) generating electrons, yielding SrFe2-x CoxAs2 with a TC = 20 K [129]. Lattice parameters are a = b = 3.925 Å, c = 12.35 Å.
(60a)
(60b)
Finally, CaFe2As2 does not yield superconductivity in its pure form, but only with a fifth rare-earth elemental doping, such as Re = La, Ce, Pr atom doping, with Pr doping (x = 0.1) Ca1-xPrxFe2As2, and the highest TC = 49 K [130]. Lattice parameters in this collapsed tetragonal state are a = b = 3.97 Å, c = 10.61 Å (down from the ambient value of c = 11.69 Å).
(61a)
(61b)
Note here that talking about pnictides using externally applied pressure to elevate TC is not done to prepare HTC superconductors for ready application in grid power lines, because one desires room temperature operation under standard conditions, which means no use of high pressures.
Compared with other families, the synthesis of the 122 compounds is relatively easy, which facilitates the investigation of these systems.
E. 42622-type such as and 32522-type such as
Ca4Al2O6Fe2As2 requires doping to give Ca4Al2O6-yFe2As2 and is of the general class Al-42622(Pn), Ca4Al2O6-yFe2(Pn)2, where Pn = As, P [131,132]. These new materials are synthesized by using the high-pressure synthesis method. Al-42622 shows a superconducting critical temperature Tc at 28.3 K for Pn = As and 17.1 K for Pn = P. It is well-known that the Fe–As layers responsible for superconductivity create the charge carriers and transfer them to the perovskite blocking layers. Within the series of blocking layers, Tc strongly depends on the crystal structure parameter such as the As–Fe–As tetrahedron bond angle α. Replacement of key atoms by smaller ionic radius atoms causes considerable shrinkage in the lattice constant making α approach the regular ideal tetrahedron angle α = 109.5°, resulting in emergence of superconductivity with Tc becoming a maximum when As–Fe–As α approaches 109.5°. The lattice parameters of Al-42622(Pn) are a = 3.713 Å, c = 15.407 Å, and 3.692 Å, c = 14.934 Å for Pn = As and P, respectively, are the smallest among the iron-pnictide superconductors. Correspondingly, Al-42622(As) has the smallest As–Fe–As bond angle α = 102.1° and the largest As distance from the Fe planes dAs-Fe = 1.5 Å.
Unit cell volume for a tetrahedron requires knowledge of lattice dimensions a and c. It is given by
Thus, for Pn = As,
(62a)
(62b)
When Pn = P,
(63a)
(63b)
, which again is synthesized by using the high-pressure method, and requires doping to give superconductivity as , and is of the general class Al-32522(Pn), where Pn = As, P. Al-32522(Pn) shows a Tc at 30.2 K for Pn = As and 16.6 K for Pn = P [133].
Figure 10 gives the pnictide superconductor TC versus unit cell volume.
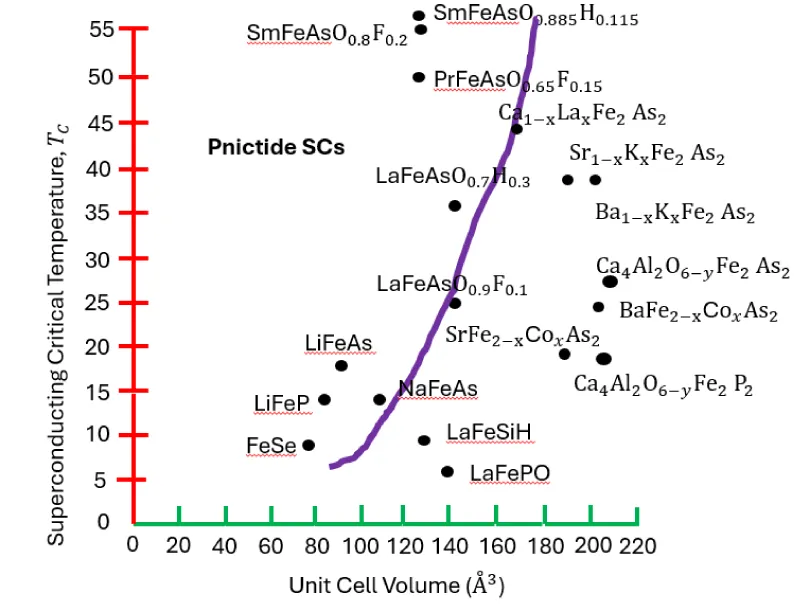
Figure 10: Shows the pnictide superconductor Tc vs. unit cell volume (Å).
One concludes from inspection of Figure 10 that there is a rough increase in TC with increasing unit cell volume.
Much can be discerned from examination of the elemental superconducting materials, cuprate high-temperature superconducting materials, and the pnictide superconducting materials. Especially remarkable is the maximum TC seen for the pnictide SC materials, which is roughly . Since the consensus, looking at all of the literature in the pnictide SC area, seems to be that there is a non-BCS mechanism responsible for the superconductivity, likely a spin-mediated anti-ferromagnetic phenomenon, the contribution based on additive Hamiltonian matrix elements, would be to utilize (43), and break out each mechanism contribution to the critical SC temperature
(62)
Here, the summation is over all energy exchange mechanisms contributing to the Hamiltonian. Equation (62) is very telling. It says that it may be very likely that each mechanism contributing to TC gives about 50 K toward upping the critical temperature.
Now turn attention to the element SCs. There we saw that . It is known that electron-phonon energy exchange is responsible for this superconductivity. This is the conventional superconductivity, known as the BCS type of superconductivity. Let’s be generous and identify the maximum BCS type of superconductivity as This then gives us insight into understanding the original of the maximum, under standard conditions, for cuprate SCs, which is on the order of Because it is understood from the literature that charge density waves (CDW) may be active in curate SCs, and spin density waves (SDW) have also been identified, this may be all that is necessary to explain the highest seen of all superconducting material TC's in cuprates, once one accepts the likely possibility that BCS type of conventional superconductivity is also contributing to TC. Thus, for cuprate SCs, the equation for TC is
(63)
The next question, given the understanding gained from these arguments, is how to elevate the TC toward room temperature operation. Clearly, three other mechanisms must be found if one associates a maximum contributing of 50 K, recognizing that standard room temperature conditions are associated with a temperature of . But one may also use other temperatures as a reference, such as . An approximation to any of these chosen standard-like conditions would be to use 300 K, and that gives us
(64)
This presentation has covered the quantum wave nature of the superconducting electrons, the 3D crystal lattice effect on the quantum wavefunction pairing overlap, orbital spatial characteristics, and the energy exchange mechanisms relationship to the critical superconducting temperature TC. Shown also are the trends for elemental, cuprate, and pnictide superconductors.
It has been discovered that tractable relationships can be derived that relate the energy exchange mechanisms to TC. Forecasting which new solid-state chemical compounds will yield much higher results and lead to practical implementation is a very difficult problem. However, in our treatment, how potential energy exchange mechanisms may contribute to both the Hamiltonians and the mechanism critical , provides a way forward to elevate the superconducting critical temperature to room temperature.
- Krowne CM. Microscopic quantum mechanical Marcus theory for chemical reactions and its relationship to the Butler-Volmer equation used in redox flow battery analysis. Int J Quantum Chem. 2024;124(1). Available from: https://doi.org/10.1002/qua.27279
- Krowne CM. Nernst equations and concentration chemical reaction over potentials for VRFB operation. J Electrochem Soc. 2023;170:100534. Available from: https://doi.org/10.1149/1945-7111/ad0073
- Krowne CM. Analytical current-voltage formulas in electrodes and concentration differences for VRFB. Electrochim Acta. 2024;476:143709. Available from: https://doi.org/10.1016/j.electacta.2023.143709
- Krowne CM. Physics, electrochemistry, chemistry, and electronics of the vanadium redox flow battery by analyzing all the governing equations. Phys Chem Chem Phys. 2024;26:2823-2862. Available from: https://pubs.rsc.org/en/content/articlelanding/2024/cp/d3cp04223e
- Krowne CM. Spatial distribution of pressure using fluid physics for the vanadium redox flow battery and minimizing fluid crossover between the battery electrodes. J Electrochem Soc. 2024;171:020537. Available from: https://doi.org/10.1149/1945-7111/ad2734
- Krowne CM. Fluid physics impacting the vanadium and other redox flow batteries. J Electrochem Soc. 2024;171:060517. Available from: https://doi.org/10.1149/1945-7111/ad5252
- Krowne CM. Determination of the ion concentrations in VRFB by non-invasive optical techniques due to chemical reactions, complexes and side reactions. J Electrochem Soc. 2024;171:020546. Available from: https://doi.org/10.1149/1945-7111/ad2818
- Krowne CM. Measures of performance of the vanadium and other redox flow batteries. J Electrochem Soc. 2024;171:050538. Available from: https://doi.org/10.1149/1945-7111/ad4824
- Krowne CM. State of charge (SoC) of the vanadium and other redox flow batteries: identification of the electrode and bipolar plate contributions. J Electrochem Soc. 2024;171:100523. Available from: https://doi.org/.1149/1945-7111/ad80d4
- Krowne CM. Charging electrochemistry, electronics and fluid requirements for redox flow batteries. J Electrochem Soc. 2025;172:100525. Available from: https://doi.org/:10.1149/1945-7111/ae0f5a
- Daniel M, Byron NP, Krowne CM. Harnessing redox flow batteries for industrial applications: opportunities and future directions. J Power Sources. 2023;591:233889. Available from: https://doi.org/10.1016/j.jpowsour.2023.233889
- Kamihara Y, Hiramatsu H, Hirano M, Kawamura R, Yanagi H, Kamiya T, et al. Iron-based layered superconductor: LaOFeP. J Am Chem Soc. 2006;128(31):10012-10013. Available from: https://doi.org/10.1021/ja063355c
- Kamihara Y, Watanabe T, Hirano M, Hosono H. Iron-based layered superconductor La[O1−xFx]FeAs (x = 0.05-0.12) with Tc = 26 K. J Am Chem Soc. 2008;130(11):3296-3297. Available from: https://doi.org/10.1021/ja800073m
- Hosono H, Tanabe K, Takayama-Muromachi E, Kageyama H, Yamanaka S, Kumakura H, et al. Exploration of new superconductors and functional materials, and fabrication of superconducting tapes and wires of iron pnictides. Sci Technol Adv Mater. 2015;16(3):033503. Available from: https://doi.org/10.1088/1468-6996/16/3/033503
- Yankowitz M, Chen S, Polshyn H, Zhang Y, Watanabe K, Taniguchi T, et al. Tuning superconductivity in twisted bilayer graphene. Science. 2019;363(6431):1059-1064. Available from: https://doi.org/10.1126/science.aav1910
- Oh M, Nuckolls KP, Wong D, Lee RL, Liu X, Watanabe K, et al. Evidence for unconventional superconductivity in twisted bilayer graphene. Nature. 2021;600:240-245. Available from: https://doi.org/10.1038/s41586-021-04121-x
- Su R, Kuiri M, Watanabe K, Taniguchi T, Folk JA. Superconductivity in twisted double bilayer graphene stabilized by WSe2. Nat Mater. 2023;22:1332-1337. Available from: https://doi.org/10.1038/s41563-023-01653-7
- Nagamatsu J, Nakagawa N, Muranaka T, Zenitani Y, Akimitsu J. Superconductivity at 39 K in magnesium diboride. Nature. 2001;410(6824):63-64. Available from: https://doi.org/10.1038/35065039
- Bud'ko SL, Canfield PC. Superconductivity of magnesium diboride. Physica C. 2015;514:142-151. Available from: https://doi.org/10.1016/j.physc.2015.02.024
- Drozdov AP, Eremets MI, Troyan IA, Ksenofontov V, Shylin SI. Conventional superconductivity at 203 kelvin at high pressures in the sulfur hydride system. Nature. 2015;525:73-76. Available from: https://doi.org/10.1038/nature14964
- Einaga M, Sakata M, Ishikawa T, Shimizu K, Eremets MI, Drozdov AP, et al. Crystal structure of the superconducting phase of sulfur hydride. Nat Phys. 2016;12:835-838. Available from: https://doi.org/10.1038/nphys3760
- Bednorz JG, Müller KA. Possible high Tc superconductivity in the Ba-La-Cu-O system. Z Phys B. 1986;64(2):189-193. Available from: https://link.springer.com/article/10.1007/BF01303701
- Buchanan M. Mind the pseudogap. Nature. 2001;409(6816):8-11. Available from: https://doi.org/DOI:10.1038/35051238
- Wu MK, Ashburn JR, Torng CJ, Hor PH, Meng RL, Gao L, et al. Superconductivity at 93 K in a new mixed-phase Y-Ba-Cu-O compound system at ambient pressure. Phys Rev Lett. 1987;58(9):908-910. Available from: https://doi.org/10.1103/PhysRevLett.58.908
- Sheng ZZ, Hermann AM. Bulk superconductivity at 120 K in the Tl-Ca/Ba-Cu-O system. Nature. 1988;332(6160):138-139. Available from: https://doi.org/10.1038/332138a0
- Schilling A, Cantoni M, Guo JD, Ott HR. Superconductivity above 130 K in the Hg-Ba-Ca-Cu-O system. Nature. 1993;363(6424):56-58. Available from: https://doi.org/10.1038/363056a0
- Lee PA. From high temperature superconductivity to quantum spin liquid: progress in strong correlation physics. Rep Prog Phys. 2008;71(1):012501. Available from: https://doi.org/10.48550/arXiv.0708.2115
- Li X, Zou C, Ding Y, Yan H, Ye S, Li H, et al. Evolution of charge and pair density modulations in overdoped Bi2Sr2CuO6+δ. Phys Rev X. 2021;11(1):011007. Available from: https://doi.org/10.1103/PhysRevX.11.011007
- Krowne CM. Examination of 2D hexagonal band structure from a nanoscale perspective for use in electronic transport devices. In: Advances in Imaging and Electron Physics. Vol. 210. Amsterdam: Elsevier Academic Press; 2019. p. 23-45.
- Osofsky MS, Hernández-Hangarter SC, Nath A, Wheeler VD, Walton SG, Krowne CM, et al. Functionalized graphene as a model system for the two-dimensional metal-insulator transition. Sci Rep. 2016;6:19939. Available from: https://doi.org/10.1038/srep19939
- Osofsky MS, Krowne CM, Charipar KM, Bussmann K, Chervin CN, Pala IR, et al. Disordered RuO2 exhibits two-dimensional, low-mobility transport and a metal-insulator transition. Sci Rep. 2016;6:21836. Available from: https://www.nature.com/articles/srep21836
- Krowne CM, Sha X. Atomic structural and electronic bandstructure calculations for borophene. Mater Res Express. 2021;8:026301. Available from: https://doi.org/10.1088/2053-1591/abdf7e?urlappend=%3Futm_source%3Dresearchgate.net%26utm_medium%3Darticle
- Sha X, Krowne CM. First-principles quantum calculations for graphyne for electronic devices. Nanoscale Adv. 2021;3:5853-5859. Available from: https://doi.org/10.1039/D1NA00336D
- Osofsky MS, Krowne CM, Soulen RJ Jr, Clements E, Woods G, Srikanth H, et al. New approaches for enhancing Tc. In: Proceedings of the 11th International Conference on Ceramic Materials and Components for Energy and Environmental Applications (CMCEE); 2015 Jun 14-19; Vancouver, Canada. Westerville (OH): American Ceramic Society; 2015.
- Osofsky MS, Prestigiacomo JC, Krowne CM, Soulen RJ Jr, Kim H, Clements E, et al. Superconductivity near the metal-insulator transition. In: Electronic Materials and Applications Conference (EMA 2016); 2016 Jan 20-22; Orlando, FL. Westerville (OH): American Ceramic Society; 2016.
- Osofsky MS, Prestigiacomo JC, Krowne CM, Soulen RJ Jr, Clements E, Woods G, Srikanth H, Takeuchi I. Superconductivity near the metal-insulator transition. In: 2016 MRS Spring Meeting & Exhibit; 2016 Mar 28-Apr 1; Phoenix, AZ. Warrendale (PA): Materials Research Society; 2016.
- Smolyaninova VN, Korzi W, Yong G, Valente-Feliciano AM, Beverstock DR, Prestigiacomo JC, et al. Effect of metamaterial engineering on the superconductive properties of ultrathin layers of NbTiN. J Appl Phys. 2021;130:073901. Available from: https://misportal.jlab.org/sti/publications/16589/attachments/1699/Effect%20of%20metamaterial%20engineering%20on%20the%20superconductive%20properties%20of%20ultrthin%20layers%20of%20NbTiN.pdf
- Krowne CM. Nanowire and nanocable junction capacitances: results for metal and semiconducting oxides. Phys Lett A. 2010;374:1172-1179. Available from: https://doi.org/10.1016/j.physleta.2009.12.056
- Martinez JI, Calle-Vallejo F, Krowne CM, Alonso JA. First-principles structural and electronic characterization of ordered SiO2 nanowires. J Phys Chem C. 2012;116:18973-18982. Available from: https://doi.org/10.1021/jp3009223
- Martinez JI, Abad E, Calle-Vallejo F, Krowne CM, Alonso JA. Tailoring structural and electronic properties of RuO2 nanotubes: many-body approach and electronic transport. Phys Chem Chem Phys. 2013;15(35):14715-14722. Available from: https://doi.org/10.1039/C3CP52092G
- Cohen-Tannoudji C, Diu B, Laloe F. Quantum Mechanics. Vols. I-II. New York: Wiley; 1977.
- Krowne CM. Disorder modifications of the critical temperature for superconductivity: a perspective from the point of view of nanoscience. In: Advances in Imaging and Electron Physics. Vol. 202. Amsterdam: Elsevier; 2017. p. 39-74.
- Krowne CM. Critical magnetic field and its slope, specific heat, and gap for superconductivity as modified by nanoscopic disorder. In: Advances in Imaging and Electron Physics. Vol. 203. Amsterdam: Elsevier; 2017. p. 67-97. Available from: https://discovery.researcher.life/article/critical-magnetic-field-and-its-slope-specific-heat-and-gap-for-superconductivity-as-modified-by-nanoscopic-disorder/b467572108dc3a8fb60ad60f3f366841
- Shekhter A, Ramshaw BJ, Liang R, Hardy WN, Bonn DA, Balakirev FF, et al. Bounding the pseudogap with a line of phase transitions in YBa2Cu3O6+δ. Nature. 2013;498:75-77. Available from: https://doi.org/10.1038/nature12165
- Kaiser S, Hunt CR, Nicoletti D, Hu W, Gierz I, Liu H, et al. Optically induced coherent transport far above Tc in underdoped YBa2Cu3O6+δ. Phys Rev B. 2014;89:184516. Available from: https://doi.org/10.1103/PhysRevB.89.184516
- Kao YH, Yao YD, Jang LY, Xu F, Krol A, Song LW, et al. Effects of silver doping in the high-Tc superconductor system Y-Ba-Cu-O. J Appl Phys. 1990;67:353-361. Available from: https://doi.org/10.1063/1.345261
- Tallon JL, Bernhard C, Shaked H, Hitterman RL, Jorgensen JD, et al. Generic superconducting phase behaviour in high-Tc cuprates: Tc variation with hole concentration in YBa2Cu3O7−δ. Phys Rev B. 1995;51(18):12911-12914. Available from: https://doi.org/10.1103/physrevb.51.12911
- Goutenoire F, Maignan A, Van Tendeloo G, Martin C, Michel C, Hervieu M, et al. Substitution of mercury for thallium in the 2223-cuprate: the 130 K superconductor Tl1.6Hg0.4Ba2Ca2Cu3O10−δ. Solid State Commun. 1994;90(1):47-50. Available from: https://ui.adsabs.harvard.edu/abs/1994SSCom..90...47G/abstract
- Mumtaz M, Khan NA, Khurram AA. Enhanced superconducting properties of Cu0.5(Tl0.5−yHgy)Ba2Ca3Cu4O12−δ (y = 0, 0.15, 0.25, 0.35) superconductor. J Alloys Compd. 2008;452(2):435-440. Available from: https://www.researchgate.net/publication/236152035_Enhanced_superconducting_properties_of_Cu0_5_Tl0_5-yHgy_Ba2Ca3Cu4O12-d_y
- Sheng ZZ, Hermann AM, El Ali A, Almasan C, Estrada J, Datta T, et al. Superconductivity at 90 K in the Tl-Ba-Cu-O system. Phys Rev Lett. 1988;60(10):937-940. Available from: https://doi.org/10.1103/PhysRevLett.60.937
- Sheng ZZ, Hermann AM. Superconductivity in the rare-earth-free Tl-Ba-Cu-O system above liquid-nitrogen temperature. Nature. 1988;332(6159):55-58. Available from: https://doi.org/10.1038/332055a0
- Sunshine SA, Siegrist T, Schneemeyer LF, Murphy DW, Cava RJ, Batlogg B, et al. Structure and physical properties of single crystals of the 84-K superconductor Bi2.2Sr2Ca0.8Cu2O8+δ. Phys Rev B. 1988;38(1):893-896. Available from: https://doi.org/10.1103/PhysRevB.38.893
- Subramanian MA, Torardi CC, Calabrese JC, Gopalakrishnan J, Morrissey KJ, Askew TR, et al. A new high-temperature superconductor: Bi2Sr3−xCaxCu2O8+y. Science. 1988;239(4843):1015-1017. Available from: https://doi.org/10.1126/science.239.4843.1015
- Tallon JL, Buckley RG, Gilberd PW, Presland MR, Brown IWM, Bowd ME, et al. High-Tc superconducting phases in the series Bi2.1(Ca,Sr)n+1CunO2n+4+δ. Nature. 1988;333(6169):153-156. Available from: https://doi.org/10.1038/333153a0
- Presland MR, Tallon JL, Buckley RG, Liu RS, Flower NE. General trends in oxygen stoichiometry effects on Tc in Bi and Tl superconductors. Physica C. 1991;176(1-3):95-105. Available from: https://ui.adsabs.harvard.edu/abs/1991PhyC..176...95P/abstract
- Togano K. Properties of Pb-doped Bi-Sr-Ca-Cu-O superconductors. Appl Phys Lett. 1988;53(14):1329-1331. Available from: https://www.semanticscholar.org/paper/Magnetic-Properties-of-Pb-Doped-Bi-Sr-Ca-Cu-O-Kumakura-Togano/299d271b25dd1d470084c13eba5ef6961cd59094
- Maeda H, Tanaka Y, Fukutumi M, Asano T. A new high-Tc oxide superconductor without a rare earth element. Jpn J Appl Phys. 1988;27(2).L209-L210. Available from: https://garfield.library.upenn.edu/classics1993/A1993KV05800001.pdf
- Tokiwa-Yamamoto A, Isawa K, Itoh M, Adachi S, Yamauchi H. Composition, crystal structure and superconducting properties of Hg-Ba-Cu-O and Hg-Ba-Ca-Cu-O superconductors. Physica C. 1993;216(3-4):250-256.
- Antipov EV, Loureiro SM, Chaillout C, Capponi JJ, Bordet P, Tholence JL, et al. The synthesis and characterization of the HgBa2Ca2Cu3O8+δ and HgBa2Ca3Cu4O10+δ phases. Physica C. 1993;215(1-2):1-10. Available from: https://ui.adsabs.harvard.edu/abs/1993PhyC..216..250T/abstract
- Radaelli PG, Wagner JL, Hunter BA, Beno MA, Knapp GS, Jorgensen JD, et al. Structure, doping and superconductivity in HgBa2CaCu2O6+δ (Tc ≤128 K). Physica C. 1993;216(1-2):29-35. Available from: https://ui.adsabs.harvard.edu/abs/1993PhyC..216...29R/abstract
- Putilin SN, Antipov EV, Chmaissem O, Marezio M. Superconductivity at 94 K in HgBa2CuO4+δ. Nature. 1993;362:226-228.
- Ihara H, Sugise R, Hirabayashi M, Terada N, Jo M, Hayashi K, et al. A new high-Tc TlBa2Ca3Cu4O11 superconductor with Tc >120 K. Nature. 1988;334(6182):510-512. Available from: https://www.semanticscholar.org/paper/A-new-high-Tc-TlBa2Ca3Cu4O11-superconductor-with-Tc-Ihara-Sugise/ed0064745f75e3499a3e9af2c5f3dbed75c9d4bc
- Torardi CC, Subramanian MA, Calabrese JC, Gopalakrishnan J, Morrissey KJ, Askew TR, et al. Crystal structure of Tl2Ba2Ca2Cu3O10, a 125 K superconductor. Science. 1988;240:631-634. Available from: https://doi.org/10.1126/science.240.4852.631
- Lejay P, de Rango P, Sulpice A, Giordanengo B, Tournier R, Retoux R, et al. Superconductivity up to 110 K in Bi2Sr2Ca2Cu3O10 compounds. Rev Phys Appl. 1989;24:485-488. Available from: https://hal.science/jpa-00246071/document
- Jacobs T. Unraveling the cuprate superconductor phase diagram: intrinsic tunneling spectroscopy and electrical doping [dissertation]. Stockholm (Sweden): Stockholm University; 2016. Available from: https://www.semanticscholar.org/paper/Unraveling-the-cuprate-superconductor-phase-diagram-Jacobs/450170d36488d0bb90d7fbd4b48fb65d8148e39b
- Jacobs T, Katterwe SO, Motzkau H, Rydh A, Maljuk A, et al. Electron tunneling measurements of low-Tc single-layer Bi2+xSr2−yCuO6: evidence for a scaling disparity between superconducting and pseudogap states. Phys Rev B. 2012;86:214506. Available from: https://doi.org/10.1103/PhysRevB.86.214506
- Motzkau H, Jacobs T, Katterwe SO, Rydh A, Krasnov VM. Persistent electrical doping of Bi2Sr2CaCu2O8+δ mesa structures. Phys Rev B. 2012;85:144519. Available from: https://doi.org/10.1103/PhysRevB.85.144519
- Katterwe SO, Jacobs T, Maljuk A, Krasnov VM. Low anisotropy of the upper critical field in a strongly anisotropic layered cuprate: evidence for paramagnetically limited superconductivity. Phys Rev B. 2014;89:214516. Available from: https://doi.org/10.1103/PhysRevB.89.214516
- Jacobs T, Simsek Y, Koval Y, Muller P, Krasnov VM. Sequence of Quantum Phase Transitions in Bi2Sr2CaCu2O(8+δ) Cuprates Revealed by In Situ Electrical Doping of One and the Same Sample. Phys Rev Lett. 2016;116:067001. Available from: https://doi.org/10.1103/PhysRevLett.116.067001
- Jacobs T, Katterwe SO, Krasnov VM. Superconducting correlations above Tc in the pseudogap state of Bi2Sr2CaCu2O8+δ cuprates revealed by angular-dependent magnetotunneling. Phys Rev B. 2016;94:220501(R). Available from: https://doi.org/10.1103/PhysRevB.94.220501
- Howe BA. Crystal structure and superconductivity of YBa2Cu3O7−x [master's thesis]. Mankato (MN): Minnesota State University; 2014. Available from: https://cornerstone.lib.mnsu.edu/cgi/viewcontent.cgi?article=1345&context=etds
- Kamihara Y, Hiramatsu H, Kawamura R, Yanagi H, Kamiya T, Hosono H. Iron-based layered superconductor in LaOFeP. J Am Chem Soc. 2006;128:10012-10013. Available from: https://doi.org/10.1021/ja063355c
- McQueen TM, Regulacio M, Williams AJ, Huang Q, Lynn JW, Hor YS, et al. Intrinsic properties of stoichiometric LaFePO. Phys Rev B. 2008;78(2):024521. Available from: https://doi.org/10.1103/PhysRevB.78.024521
- Hamlin JJ, Baumbach RE, Zocco DA, Sayles TA, Maple MB. Superconductivity in single crystals of LaFePO. J Phys Condens Matter. 2008;20:365220. Available from: https://iopscience.iop.org/article/10.1088/0953-8984/20/36/365220
- Sutherland M, Dunn J, Toews WH, O'Farrell E, Analytis JG, Fisher I, et al. Low-energy quasiparticles probed by heat transport in the iron-pnictide superconductor LaFePO. Phys Rev B. 2012;85(1):014517. Available from: https://doi.org/10.1103/PhysRevB.85.014517
- Hicks CW, Lippman TM, Huber ME, Analytis JG, Chu JH, Erickson AS, et al. Evidence for a nodal energy gap in the iron-pnictide superconductor LaFePO from penetration depth measurements by scanning SQUID susceptometry. Phys Rev Lett. 2009;103(12):127003. Available from: https://doi.org/10.1103/PhysRevLett.103.127003
- Kamihara Y, Watanabe T, Hirano M, Hosono H. Iron-based layered superconductor LaFeAsO1−xFx (x = 0.05-0.12) with Tc = 26 K. J Am Chem Soc. 2008;130(11):3296-3297. Available from: https://doi.org/10.1021/ja800073m
- McGuire MA, Christianson AD, Sefat AS, Sales BC, Lumsden MD, Jin R, et al. Phase transitions in LaFeAsO: structural, magnetic, elastic, and transport properties, heat capacity and Mössbauer spectra. Phys Rev B. 2008;78:094517. Available from: https://doi.org/10.1103/PhysRevB.78.094517
- Klingeler R, Leps N, Hellmann I, Popa A, Stockert U, Hess C, et al. Local antiferromagnetic correlations in the iron pnictide superconductors LaFeAsO1−xFx and Ca(Fe1−xCox)2As2 as seen via normal-state susceptibility. Phys Rev B. 2010;81:024506. Available from: https://doi.org/10.1103/PhysRevB.81.024506
- Mazin II, Singh DJ, Johannes MD, Du MH. Unconventional superconductivity with a sign reversal in the order parameter of LaFeAsO1−xFx. Phys Rev Lett. 2008;101:057003. Available from: https://doi.org/10.1103/PhysRevLett.101.057003
- Kuroki K, Onari S, Arita R, Usui H, Tanaka Y, Kontani H, et al. Unconventional pairing originating from the disconnected Fermi surfaces of superconducting LaFeAsO1−xFx. Phys Rev Lett. 2008;101:087004. Available from: https://doi.org/10.1103/PhysRevLett.101.087004
- Haule K, Shim JH, Kotliar G. Correlated electronic structure of LaO1−xFxFeAs. Phys Rev Lett. 2008;100:226402. Available from: https://doi.org/10.1103/PhysRevLett.100.226402
- Ahilan K, Ning FL, Imai T, Sefat AS, Jin R, McGuire MA, et al. 19F NMR investigation of the iron pnictide superconductor LaFeAsO0.89F0.11. Phys Rev B. 2008;78:100501. Available from: https://doi.org/10.1103/PhysRevB.78.100501
- Sakurai R, Fujiwara N, Kawaguchi N, Yamakawa Y, Kontani H, Iimura S, et al. Quantum critical behavior in heavily doped LaFeAsO1−xHx pnictide superconductors analyzed using nuclear magnetic resonance. Phys Rev B. 2015;91:064509. Available from: https://doi.org/10.1103/PhysRevB.91.064509
- Luetkens H, Klauss HH, Khasanov R, Amato A, Klingeler R, Hellmann I, et al. Field and temperature dependence of the superfluid density in LaFeAsO1−xFx superconductors: a muon spin relaxation study. Phys Rev Lett. 2008;101:097009. Available from: https://doi.org/10.1103/physrevlett.101.097009
- Chen XH, Wu T, Wu G, Liu RH, Fang DF, Chen NL. Superconductivity at 43 K in SmFeAsO1−xFx. Nature. 2008;453:761-762. Available from: https://doi.org/10.1038/nature07045
- Sanna S, De Renzi R, Lamura G, Ferdeghini C, Palenzona A, Putti M, et al. Magnetic-superconducting phase boundary of SmFeAsO1−xFx studied via muon spin rotation: unified behavior in a pnictide family. Phys Rev B. 2009;80:052503. Available from: https://doi.org/10.1103/PhysRevB.80.052503
- McGuire MA, Hermann RP, Sefat AS, Sales BC, Jin R, Mandrus D, et al. Influence of the rare-earth element on the effects of the structural and magnetic phase transitions in CeFeAsO, PrFeAsO and NdFeAsO. New J Phys. 2009;11:025011. Available from: https://doi.org/10.1088/1367-2630/11/2/025011
- Okazaki R, Konczykowski M, van der Beek CJ, Kato T, Hashimoto K, et al. Lower critical fields and the anisotropy in PrFeAsO1−y single crystals. Physica C. 2009;470(Suppl 1). S485-S486. Available from: https://doi.org/10.1016/j.physc.2009.12.041
- Gretarsson H, Lupascu A, Kim J, Casa D, Gog T, Wu W, et al. Revealing the dual nature of magnetism in iron pnictides and iron chalcogenides using X-ray emission spectroscopy. Phys Rev B. 2011;84:100509. Available from: https://doi.org/10.1103/PhysRevB.84.100509
- Nishi I, Ishikado M, Ideta S, Mataeb W, Yoshida T, Fujimori A, et al. Angle-resolved photoemission spectroscopy study of PrFeAsO0.7: comparison with LaFePO. Phys Rev B. 2011;84:014504. Available from: https://doi.org/10.1103/PhysRevB.84.014504
- Shirai K, Kashiwaya H, Miura S, Ishikado M, Eisaki H, et al. Local transport properties of PrFeAsO0.7 using FIB micro-fabrication. Physica C. 2010;470(20):1473-1476. Available from: https://doi.org/10.1016/j.physc.2010.05.141
- Bhoi D, Mandal P, Choudhury P. Vortex dynamics and second magnetization peak in PrFeAsO0.60F0.12 superconductor. J Appl Phys. 2013;113:183902. Available from: https://doi.org/10.1063/1.4803875
- Kim MJ, Ratcliff W 2nd, Pajerowski DM, Kim JW, Yan JQ, et al. Magnetic ordering and structural distortion in a PrFeAsO single crystal studied by neutron and X-ray scattering. Phys Rev B. 2021;103:174405. Available from: https://doi.org/10.1103/PhysRevB.103.174405
- Bernardini F, Garbarino G, Sulpice A, Núñez-Regueiro M, Gaudin E, Chevalier B, et al. Iron-based superconductivity extended to the novel silicide LaFeSiH. Phys Rev B. 2018;97:100504(R). Available from: https://doi.org/10.1103/PhysRevB.97.100504
- Bhattacharyya A,Rodière P, Vaney J-B, Biswas PK, Hillier AD, Bosin A, et al. Evidence of nodal superconductivity in LaFeSiH. Phys Rev B. 2020;102:224502. Available from: https://doi.org/10.1103/PhysRevB.101.224502
- Hansen MF, Layek S, Vaney J-B, Chaix L, Suchomel MR, Mikolasek M, et al. Magnetic and structural properties of the iron silicide superconductor LaFeSiH. Phys Rev B. 2024;109:174523. Available from: https://doi.org/10.1103/PhysRevB.109.174523
- Hansen MF, Vaney JB, de Rango P, Salaun M, Tence S, et al. In-situ deuteration study of LaFeSi into superconducting LaFeSi(H,D). J Alloys Compd. 2023;169281. Available from: https://hal.science/hal-04029090v1/file/01122022_In_situ_hydrogenation_of_LaFeSi.pdf
- Sourd J, Vignolle B, Gaudin E, Burdin S, Tence S. Superconductivity, Kondo physics and magnetic order: tuning the ground state in the La1−xCexFeSiH solid solution through the interplay between 3d and 4f correlated electrons. arXiv [Preprint]. 2026. arXiv:2601.04097. Available from: https://doi.org/10.1103/f1xt-1x8g
- Tapp JH, Tang Z, Lv B, Sasmal K, Lorenz B, Chu PCW, Guloy AM, et al. LiFeAs: an intrinsic FeAs-based superconductor with Tc = 18 K. Phys Rev B. 2008;78:060505(R). Available from: https://doi.org/10.1103/PhysRevB.78.060505
- Chu CW, Chen F, Gooch M, Guloy AM, Lorenz B, Lv B, et al. The synthesis and characterization of LiFeAs and NaFeAs. Physica C. 2009;469:326-331. Available from: https://doi.org/10.48550/arXiv.0902.0806
- Umezawa K, Li Y, Miao H, Nakayama K, Liu ZH, Richard P, et al. Unconventional anisotropic s-wave superconducting gaps of the LiFeAs iron-pnictide superconductor. Phys Rev Lett. 2012;108:037002. Available from: https://doi.org/10.1103/physrevlett.108.037002
- Kim H, Tanatar MA, Song YJ, Kwon YS, Prozorov R. Nodeless two-gap superconducting state in single crystals of the stoichiometric iron pnictide LiFeAs. Phys Rev B. 2011;83:100502(R). Erratum in: Phys Rev B. 2011;83:109903. Available from: https://doi.org/10.1103/PhysRevB.83.100502
- Day RP, Na MX, Zingl M, Zwartsenberg B, Michiardi M, Levy G, et al. The three-dimensional electronic structure of LiFeAs: strong-coupling superconductivity and topology in the iron pnictides. Phys Rev B. 2021;105:155142. Available from: https://doi.org/10.1103/PhysRevB.105.155142
- Platt C, Thomale R, Hanke W. From density functional theory to the functional renormalization group: superconductivity in the iron pnictide LiFeAs. Phys Rev B. 2011;84:235121. Available from: https://doi.org/10.48550/arXiv.1103.2101
- Brydon PMR, Daghofer M, Timm C, van den Brink J. Theory of magnetism and triplet superconductivity in LiFeAs. Phys Rev B. 2011;83:060501(R). Available from: https://doi.org/10.1103/PhysRevB.83.060501
- Ma L, Zhang J, Chen GF, Yu W. NMR evidence of strongly correlated superconductivity in LiFeAs: tuning toward a spin-density-wave ordering. Phys Rev B. 2010;82:180501(R). Available from: https://doi.org/10.1103/PhysRevB.82.180501
- Parker DR, Pitcher MJ, Baker PJ, Franke I, Lancaster T, Blundell SJ, Clarke SJ. Structure and superconductivity in NaFeAs. Chem Commun (Camb). 2009:2189-2191. Available from: https://doi.org/10.1039/b818911k
- Chen GF, Hu WZ, Luo JL, Wang NL. Multiple phase transitions in single-crystalline Na1−δFeAs. Phys Rev Lett. 2009;102:227004. Available from: https://doi.org/10.1103/physrevlett.102.227004
- Yi M, Lu DH, Moore RG, Kihou K, Lee CH, Iyo A, et al. Electronic reconstruction through the structural and magnetic transitions in detwinned NaFeAs. New J Phys. 2012;14:073019. Available from: https://arxiv.org/pdf/1111.6134
- He C, Zhang Y, Wang XF, Jiang J, Chen F, Yang LX, et al. The orbital characters and kz dispersions of bands in iron-pnictide NaFeAs. J Phys Chem Solids. 2011;72(5):479-482. Available from: https://doi.org/10.1016/j.jpcs.2010.10.078
- Watson MD, Aswartham S, Rhodes LC, Parrett B, Iwasawa H, Hoesch M, et al. Three-dimensional electronic structure of the nematic and antiferromagnetic phases of NaFeAs. Phys Rev B. 2018;97:035134. Available from: https://doi.org/10.1103/PhysRevB.97.035134
- Rosenthal EP, Andrade EF, Arguello CJ, Fernandes RM, Xing LY, Wang XC, et al. Visualization of electron nematicity and unidirectional antiferroic fluctuations at high temperatures in NaFeAs. Nat Phys. 2014;10:225-232. Available from: https://doi.org/10.1038/nphys2870
- Nekrasov IA, Pavlov NS, Sadovskii MV. Electronic structure of NaFeAs superconductor: LDA+DMFT calculations compared to the ARPES experiment. JETP Lett. 2015;102:26-31. Available from: https://doi.org/10.1134/S0021364015130123
- Deng Z, Wang XC, Liu QW, Zhang SJ, Lv YX, Zhu JL, et al. A new “111” type iron pnictide superconductor LiFeP. Europhys Lett. 2009;87(3):37004.
- Ferber J, Jeschke HO, Valentí R. Fermi surface topology of LaFePO and LiFeP. Phys Rev Lett. 2012;109:236403.
- Kim JS, Xing LY, Wang XC, Jin CQ, Stewart GR. LiFeP: a nodal superconductor with an unusually large ΔC/Tc. Phys Rev B. 2013;87:054504. Available from: https://doi.org/10.1103/PhysRevB.87.054504
- Zala VB, Vora AM, Gajjar PN. Electronic properties of iron pnictide superconductor LiFeP. AIP Conf Proc. 2019;2100:020027. Available from: https://www.semanticscholar.org/paper/Electronic-properties-of-iron-pnictide-LiFeP-Zala-Vora/42ab3b9cd276e94268734c8e04c2b4defcc4bfb5
- Hsu FC, Luo JY, Yeh KW, Chen TY, Huang TW, Wu PM, et al. Superconductivity in the PbO-type structure α-FeSe. Proc Natl Acad Sci U S A. 2008;105:(38)14262-14264. Available from: https://doi.org/10.1073/pnas.0807325105
- McQueen TM, Huang Q, Ksenofontov V, Felser C, Xu Q, Zandbergen H, et al. Extreme sensitivity of superconductivity to stoichiometry in Fe1+δSe. Phys Rev B. 2009;79:014522. Available from: https://doi.org/10.1103/PhysRevB.79.014522
- Subedi A, Zhang L, Singh DJ, Du MH. Density functional study of FeS, FeSe, and FeTe: electronic structure, magnetism, phonons, and superconductivity. Phys Rev B. 2008;78:134514. Available from: https://doi.org/10.1103/PhysRevB.78.134514
- Rotter M, Tegel M, Johrendt D. Superconductivity at 38 K in the iron arsenide (Ba1−xKx)Fe2As2. Phys Rev Lett. 2008;101(10):107006. Available from: https://doi.org/10.1103/PhysRevLett.101.107006
- Sefat AS, Jin R, McGuire MA, Sales BC, Singh DJ, Mandrus D. Superconductivity at 22 K in Co-doped BaFe2As2 crystals. Phys Rev Lett. 2008;101:117004. Available from: https://doi.org/10.1103/PhysRevLett.101.117004
- Sen S, Ghosh H. Fermiology of the 122 family of Fe-based superconductors: an ab initio study. Phys Lett A. 2015;379(9):843-847.
- Tarantini C, Alam Limon S, Mao K, Hellstrom EE, Kametani F. Evidence of multiscale supercurrents in K-doped BaFe2As2. Supercond Sci Technol. 2025;38:045023. Available from: https://www.osti.gov/servlets/purl/3011585
- Li LJ, Luo YK, Wang QB, Chen H, Ren Z, Tao Q, et al. Superconductivity induced by Ni doping in BaFe2As2 single crystals. New J Phys. 2009;11:025008. Available from: https://ui.adsabs.harvard.edu/link_gateway/2009NJPh...11b5008L/doi:10.48550/arXiv.0809.2009
- Sun DL, Xiao JZ, Lin CT. Growth and annealing effect of Co-doped BaFe2As2 single crystals. J Cryst Growth. 2011;323(1):55-59. Available from: https://doi.org/10.1016/j.jcrysgro.2011.02.033
- Sasmal K, Lv B, Lorenz B, Guloy AM, Chen F, Xue YY, Chu CW. Superconducting Fe-based compounds (A1−xSrx)Fe2As2 with A = K and Cs with transition temperatures up to 37 K. Phys Rev Lett. 2008;101(10):107007. Available from: https://doi.org/10.1103/physrevlett.101.107007
- Marra P, Nigro A, Li Z, Chen GF, Wang NL, Luo JL, Noce C. Paraconductivity of the K-doped SrFe2As2 superconductor. New J Phys. 2012;14:043001.Available from: https://doi.org/10.1088/1367-2630/14/4/043001
- Leithe-Jasper A, Schnelle W, Geibel C, Rosner H. Superconducting state in SrFe2−xCoxAs2 by internal doping of the iron-arsenide layers. Phys Rev Lett. 2008;101:207004. Available from: https://doi.org/10.1103/PhysRevLett.101.207004
- Lv B, Deng L, Gooch M, Wei F, Sun Y, et al. Unusual superconducting state at 49 K in electron-doped CaFe2As2 at ambient pressure. Proc Natl Acad Sci U S A. 2011;108(38):15705-15709. Available from: https://doi.org/10.1073/pnas.1112150108
- Shirage PM, Kihou K, Lee CH, Kito H, Eisaki H, Iyo A. Superconductivity at 28.3 and 17.1 K in (Ca4Al2O6−y)(Fe2Pn2) (Pn = As, P). Appl Phys Lett. 2010;97:172506. Available from: https://doi.org/10.1063/1.3508957
- Shirage PM, Kihou K, Lee CH, Kito H, Eisaki H, Iyo A. Discovery of the Ca4Al2O6Fe2Pn2 “Al-42622(Pn)” and Ca3Al2O5Fe2Pn2 “Al-32522(Pn)” (Pn = As, P) superconductors. Physica C. 2013;484:12-15.