Figure 2
Evaluation of Uranium in Organs of Residents from an Uranium-Rich Region using Teeth as Bioindicators
João DT Arruda-Neto*, Fermin Garcia and Henriette Righi
Published: 26 March, 2020 | Volume 3 - Issue 1 | Pages: 058-062

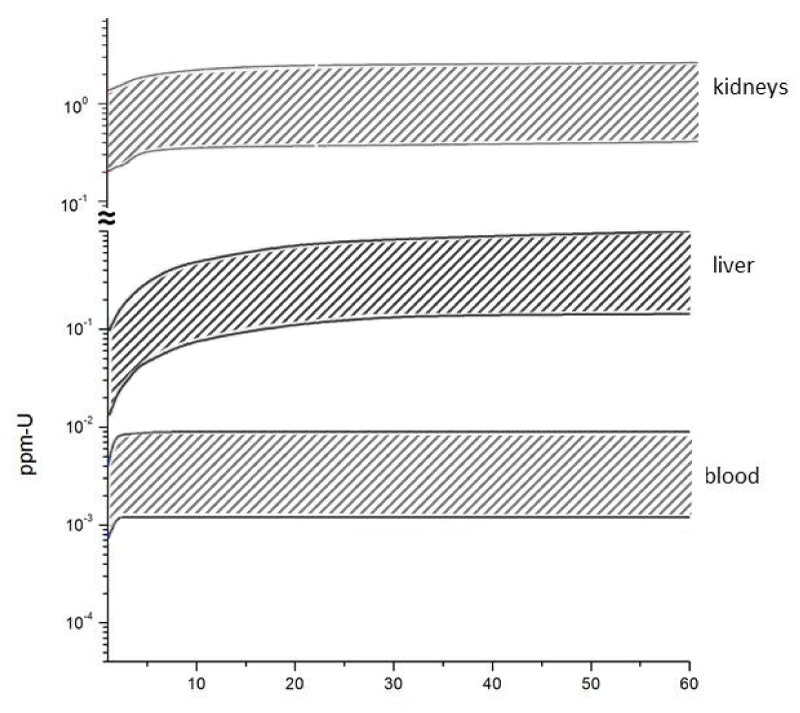
Figure 2:
Outcomes from biokinetics model calculations (this work – see text for details) referring to Uranium concentrations in organs. The two curves delimiting the shaded bands correspond, as in figure 1, to Uranium ingestion rates of 2 mg-U/d and 12 mg-U/d.
Read Full Article HTML DOI: 10.29328/journal.ijpra.1001023 Cite this Article Read Full Article PDF
More Images
Similar Articles
-
Evaluation of Uranium in Organs of Residents from an Uranium-Rich Region using Teeth as BioindicatorsJoão DT Arruda-Neto*,Fermin Garcia,Henriette Righi. Evaluation of Uranium in Organs of Residents from an Uranium-Rich Region using Teeth as Bioindicators. . 2020 doi: 10.29328/journal.ijpra.1001023; 3: 058-062
-
Finite-time thermodynamics: Realizability domains of thermodynamic systems and P. Salamon’s problem of efficiency corresponding to maximum power output of the systemTsirlin AM*,Sukin IA. Finite-time thermodynamics: Realizability domains of thermodynamic systems and P. Salamon’s problem of efficiency corresponding to maximum power output of the system. . 2018 doi: 10.29328/journal.ijpra.1001004; 1: 052-066
Recently Viewed
-
Evaluation of In vitro and Ex vivo Models for Studying the Effectiveness of Vaginal Drug Systems in Controlling Microbe Infections: A Systematic ReviewMohammad Hossein Karami*, Majid Abdouss*, Mandana Karami. Evaluation of In vitro and Ex vivo Models for Studying the Effectiveness of Vaginal Drug Systems in Controlling Microbe Infections: A Systematic Review. Clin J Obstet Gynecol. 2023: doi: 10.29328/journal.cjog.1001151; 6: 201-215
-
A General Evaluation of the Cellular Role in Drug Release: A Clinical Review StudyMohammad Hossein Karami* and Majid Abdouss*. A General Evaluation of the Cellular Role in Drug Release: A Clinical Review Study. Clin J Obstet Gynecol. 2024: doi: 10.29328/journal.cjog.1001162; 7: 042-050
-
Update on the Clinical Applications of Mesenchymal Stem CellsKhalid Ahmed Al-Anazi*. Update on the Clinical Applications of Mesenchymal Stem Cells. J Stem Cell Ther Transplant. 2023: doi: 10.29328/journal.jsctt.1001034; 7: 043-064
-
The Dynamics of Eating Behavior Disorders and the Level of General Psychological Adaptation in Bodybuilding and Fitness AthletesElena Mihaita*, Georgeta Mitrache, Marius Stoica, Rocsana Manea Bucea Tonis. The Dynamics of Eating Behavior Disorders and the Level of General Psychological Adaptation in Bodybuilding and Fitness Athletes. J Neurosci Neurol Disord. 2023: doi: 10.29328/journal.jnnd.1001081; 7: 065-089
-
Anticipation of difficulty during laparoscopic cholecystectomyMohamed Salah Abdelhamid*,Ahmed Zaki Gharib,Mohammed Abdelaal Mohammed , Mahmoud Negida. Anticipation of difficulty during laparoscopic cholecystectomy. Arch Surg Clin Res. 2020: doi: 10.29328/journal.ascr.1001048; 4: 024-028
Most Viewed
-
Evaluation of Biostimulants Based on Recovered Protein Hydrolysates from Animal By-products as Plant Growth EnhancersH Pérez-Aguilar*, M Lacruz-Asaro, F Arán-Ais. Evaluation of Biostimulants Based on Recovered Protein Hydrolysates from Animal By-products as Plant Growth Enhancers. J Plant Sci Phytopathol. 2023 doi: 10.29328/journal.jpsp.1001104; 7: 042-047
-
Feasibility study of magnetic sensing for detecting single-neuron action potentialsDenis Tonini,Kai Wu,Renata Saha,Jian-Ping Wang*. Feasibility study of magnetic sensing for detecting single-neuron action potentials. Ann Biomed Sci Eng. 2022 doi: 10.29328/journal.abse.1001018; 6: 019-029
-
Physical activity can change the physiological and psychological circumstances during COVID-19 pandemic: A narrative reviewKhashayar Maroufi*. Physical activity can change the physiological and psychological circumstances during COVID-19 pandemic: A narrative review. J Sports Med Ther. 2021 doi: 10.29328/journal.jsmt.1001051; 6: 001-007
-
Pediatric Dysgerminoma: Unveiling a Rare Ovarian TumorFaten Limaiem*, Khalil Saffar, Ahmed Halouani. Pediatric Dysgerminoma: Unveiling a Rare Ovarian Tumor. Arch Case Rep. 2024 doi: 10.29328/journal.acr.1001087; 8: 010-013
-
Prospective Coronavirus Liver Effects: Available KnowledgeAvishek Mandal*. Prospective Coronavirus Liver Effects: Available Knowledge. Ann Clin Gastroenterol Hepatol. 2023 doi: 10.29328/journal.acgh.1001039; 7: 001-010

HSPI: We're glad you're here. Please click "create a new Query" if you are a new visitor to our website and need further information from us.
If you are already a member of our network and need to keep track of any developments regarding a question you have already submitted, click "take me to my Query."


