Figure 2
Detection limit of a lutetium based non-paralizable PET-like detector
Emmanuel Busato* and Édouard Roux
Published: 16 April, 2020 | Volume 3 - Issue 1 | Pages: 063-069
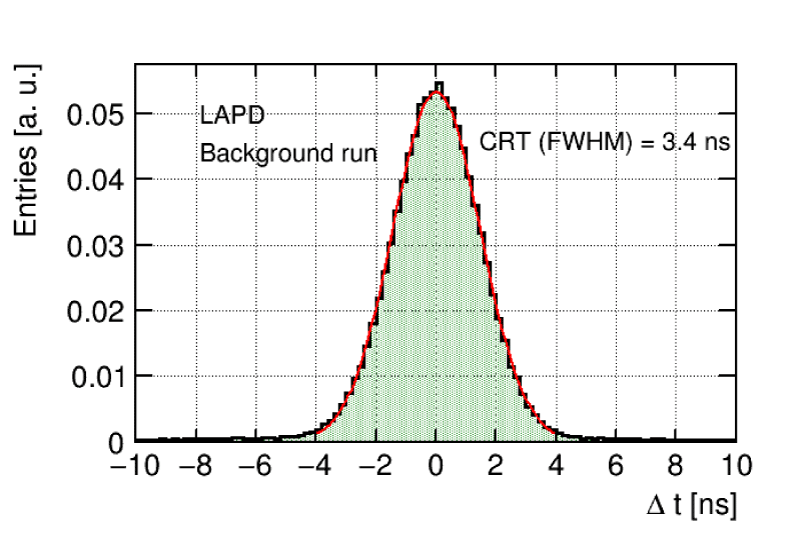
Figure 2:
Distribution of the time difference between the two pulses after trigger selection in the background run. A gaussian function fit to the data is shown in red. Only events with exactly two pulses are considered.
Read Full Article HTML DOI: 10.29328/journal.ijpra.1001024 Cite this Article Read Full Article PDF
More Images
Similar Articles
-
High energy HF (DF) lasersVictor V Apollonov*. High energy HF (DF) lasers. . 2018 doi: 10.29328/journal.ijpra.1001001; 1: 001-016
-
Magnetohydrodynamic CNTs Casson Nanofluid and Radiative heat transfer in a Rotating ChannelsZahir Shah*,Abdullah Dawar,Saeed Islam,Muhammad Idress,Waris Khan. Magnetohydrodynamic CNTs Casson Nanofluid and Radiative heat transfer in a Rotating Channels. . 2018 doi: 10.29328/journal.ijpra.1001002; 1: 017-032
-
Sounding procedure for characterization of big fusion reactor chambers by means of a compact neutron source with a nanosecond pulse durationVA Gribkov*,B Bienkowska,S Jednorog,M Paduch,Tomaszewski. Sounding procedure for characterization of big fusion reactor chambers by means of a compact neutron source with a nanosecond pulse duration. . 2018 doi: 10.29328/journal.ijpra.1001003; 1: 033-051
-
Gravitation - Flat Power FieldSA Orlov*. Gravitation - Flat Power Field. . 2018 doi: 10.29328/journal.ijpra.1001005; 1: 067-073
-
Moving space-matter as the basis of the intelligence in the Physical WorldBoris S Dizhechko*. Moving space-matter as the basis of the intelligence in the Physical World. . 2019 doi: 10.29328/journal.ijpra.1001007; 2: 001-003
-
Nanotechnology to improve the biofouling and corrosion performance of marine paints: from lab experiments to real tests in seaGeorge Kordas*. Nanotechnology to improve the biofouling and corrosion performance of marine paints: from lab experiments to real tests in sea. . 2019 doi: 10.29328/journal.ijpra.1001012; 2: 033-037
-
Biological membranes: The laboratory of fundamental physicsSamo Kralj*,Mitja Kralj. Biological membranes: The laboratory of fundamental physics. . 2019 doi: 10.29328/journal.ijpra.1001013; 2: 038-040
-
Biodegradation of gold and platinum implants in rats studied by electron microscopyLudwig Jonas*,Hendrik Kosslick,Hermann Sauer,Tino Just,Ursula Vick,Gerhard Fulda. Biodegradation of gold and platinum implants in rats studied by electron microscopy. . 2019 doi: 10.29328/journal.ijpra.1001014; 2: 041-048
-
Modeling of A.I based Inhalation for Advanced Life Support System DevelopmentMd. Sadique Shaikh*,Tanvir Begum. Modeling of A.I based Inhalation for Advanced Life Support System Development. . 2019 doi: 10.29328/journal.ijpra.1001015; 2: 049-050
-
Bio-moleculear thermal oscillator and constant heat current sourceR Panahinia*,S Behnia. Bio-moleculear thermal oscillator and constant heat current source. . 2019 doi: 10.29328/journal.ijpra.1001016; 2: 051-055
Recently Viewed
-
Significance and Prospect of Brf1 OverexpressionLiling Zheng*, Yongluan Lin, Zaifa Hong, Dongyan Shen, Shuping Zhong*. Significance and Prospect of Brf1 Overexpression. Arch Pharm Pharma Sci. 2023: doi: 10.29328/journal.apps.1001043; 7:
-
Hypersexual Disorder: A Comprehensive Review of Conceptualization, Etiology, Assessment and TreatmentShashank Tiwari*. Hypersexual Disorder: A Comprehensive Review of Conceptualization, Etiology, Assessment and Treatment. Arch Pharm Pharma Sci. 2023: doi: 10.29328/journal.apps.1001044; 7: 054-063
-
Proportion of Risk of Stroke among Male Patients Attending Outpatient Department of a Tertiary Care Hospital, Ernakulam District, KeralaBetcy George*, Susan Mathai, Ansha Mol Shaji, Christy Elsa Abraham, Jisna Johnson. Proportion of Risk of Stroke among Male Patients Attending Outpatient Department of a Tertiary Care Hospital, Ernakulam District, Kerala. Clin J Nurs Care Pract. 2024: doi: 10.29328/journal.cjncp.1001054; 8: 031-035
-
Factors Influencing Knowledge on the Completion of Treatment among Tuberculosis Patients under Directly Observed Treatment Strategy (DOTS) in a Selected Health Facility, the BahamasEsther S Daniel*, Latasha Collie, Alice Neymour, Nicole KA Martin-Chen, Kevin Moss, Kathy-Ann Lootawan, Virginia M Victor. Factors Influencing Knowledge on the Completion of Treatment among Tuberculosis Patients under Directly Observed Treatment Strategy (DOTS) in a Selected Health Facility, the Bahamas. Clin J Nurs Care Pract. 2024: doi: 10.29328/journal.cjncp.1001053; 8: 022-030
-
Preparation, solid state characterization and evaluation of ketoprofen-glucosamine HCl solid dispersionsAbdul Wahab,Gul Majid Khan*,Mohsen Sharifi,Ahmad Khan,Amjad Khan,Naqab Khan. Preparation, solid state characterization and evaluation of ketoprofen-glucosamine HCl solid dispersions. Arch Pharm Pharma Sci. 2018: doi: 10.29328/journal.apps.1001007; 2: 010-019
Most Viewed
-
Evaluation of Biostimulants Based on Recovered Protein Hydrolysates from Animal By-products as Plant Growth EnhancersH Pérez-Aguilar*, M Lacruz-Asaro, F Arán-Ais. Evaluation of Biostimulants Based on Recovered Protein Hydrolysates from Animal By-products as Plant Growth Enhancers. J Plant Sci Phytopathol. 2023 doi: 10.29328/journal.jpsp.1001104; 7: 042-047
-
Feasibility study of magnetic sensing for detecting single-neuron action potentialsDenis Tonini,Kai Wu,Renata Saha,Jian-Ping Wang*. Feasibility study of magnetic sensing for detecting single-neuron action potentials. Ann Biomed Sci Eng. 2022 doi: 10.29328/journal.abse.1001018; 6: 019-029
-
Physical activity can change the physiological and psychological circumstances during COVID-19 pandemic: A narrative reviewKhashayar Maroufi*. Physical activity can change the physiological and psychological circumstances during COVID-19 pandemic: A narrative review. J Sports Med Ther. 2021 doi: 10.29328/journal.jsmt.1001051; 6: 001-007
-
Pediatric Dysgerminoma: Unveiling a Rare Ovarian TumorFaten Limaiem*, Khalil Saffar, Ahmed Halouani. Pediatric Dysgerminoma: Unveiling a Rare Ovarian Tumor. Arch Case Rep. 2024 doi: 10.29328/journal.acr.1001087; 8: 010-013
-
Prospective Coronavirus Liver Effects: Available KnowledgeAvishek Mandal*. Prospective Coronavirus Liver Effects: Available Knowledge. Ann Clin Gastroenterol Hepatol. 2023 doi: 10.29328/journal.acgh.1001039; 7: 001-010

HSPI: We're glad you're here. Please click "create a new Query" if you are a new visitor to our website and need further information from us.
If you are already a member of our network and need to keep track of any developments regarding a question you have already submitted, click "take me to my Query."


