
More Information
Submitted: July 20, 2026 | Accepted: July 24, 2026 | Published: July 27, 2026
Citation: Melkior UF, John N. Field Assessment of a Rooftop Solar Photovoltaic–battery Hybrid System for Carbon-emission Mitigation at a Remote Site in Ngorongoro, Tanzania. Int J Phys Res Appl. 2026; 9(7): 234-244. Available from:
https://dx.doi.org/10.29328/journal.ijpra.1001161
DOI: 10.29328/journal.ijpra.1001161
Copyright license: © 2026 Melkior UF, et al. This is an open access article distributed under the Creative Commons Attribution License, which permits unrestricted use, distribution, and reproduction in any medium, provided the original work is properly cited.
Nomenclature: Battery energy storage; Capacity factor; Carbon-emission mitigation; Distributed generation; Grid emission factor; Life-cycle assessment; Self-consumption; Self-sufficiency; Solar photovoltaic; Specific yield; Tanzania

Field Assessment of a Rooftop Solar Photovoltaic–battery Hybrid System for Carbon-emission Mitigation at a Remote Site in Ngorongoro, Tanzania
Urbanus F Melkior* and Nickson John*
Department of Electrical Engineering, Arusha Technical College (ATC), Arusha, Tanzania
*Address for Correspondence: Urbanus F Melkior, Department of Electrical Engineering, Arusha Technical College (ATC), Arusha, Tanzania, Email: [email protected]
Nickson John, Department of Electrical Engineering, Arusha Technical College (ATC), Arusha, Tanzania Email: [email protected]
Sub-Saharan Africa must extend electricity access while restraining the growth of energy-sector carbon emissions. Distributed solar photovoltaic (PV) generation with battery storage is widely proposed to reconcile these aims, yet measured field evidence quantifying the achieved mitigation for small installations in remote East-African settings is scarce. This paper reports a measurement-based assessment of a rooftop PV–battery hybrid system monitored at Wasso, Ngorongoro District, Tanzania, over 165 recorded days of operation (20 January to 14 July 2026). Daily telemetry of production, consumption, grid exchange and battery activity was analysed to establish the energy balance, self-sufficiency, inferred system rating and avoided carbon emissions. The system, whose array is inferred at approximately 20 kWp, generated 8 797 kWh at a specific yield of the order of 970 kWh/kWp/yr; effectively all output was consumed on-site, meeting 51.7% of the 14 739 kWh site demand at an inferred storage round-trip efficiency of 79.3%. Applying displacement factors of 0.53 kgCO2/kWh (grid) and 0.80 kgCO2/kWh (diesel), and deducting embodied life-cycle emissions, the installation avoided 4.24–6.62 t of CO2 over the window, equivalent to 9.4–14.6 tCO2/yr and to roughly 220–344 t across a 25-year service life. The solar resource is characterised from validated satellite databases, metering accuracy is stated by reference to recognised standards, and the reported avoided-emission figures carry a propagated measurement uncertainty. The near-zero export confirms that correct storage sizing is central to maximising on-site displacement. A multi-parameter sensitivity analysis confirms the displacement emission factor as the dominant assumption, and the measured performance metrics are benchmarked against published reviews and against recent African field studies, which independently identify curtailment as a principal loss channel in operating mini-grids. The results provide an empirical reference for renewable-energy engineering practice and competency-based teaching.
Electricity demand across Sub-Saharan Africa is rising rapidly, driven by population growth, urbanisation and the extension of supply into previously unserved rural districts [1]. In the United Republic of Tanzania, national electrification remains at roughly one third of households, and rural access is considerably lower, at around one sixth [2]. Where the interconnected grid does not reach, or reaches only intermittently, demand is frequently met by diesel and petrol generating sets whose carbon intensity is high and whose fuel-supply logistics are costly and unreliable [3].
Solar photovoltaic (PV) generation is a natural response. Tanzania receives an abundant solar resource, with daily global horizontal irradiation of the order of 5–6 kWh/m² across most of the country [2,4]. The levelised cost of PV electricity has fallen sharply, reaching a global average of USD 0.044/kWh in 2023 [5], and the addition of lithium-ion battery storage allows the temporal mismatch between daytime generation and evening-dominated load to be smoothed [6,7]. The combination of falling cost, rising demand and improving storage economics makes distributed PV–battery hybrids a leading option for simultaneously improving supply security and constraining the growth of energy-sector emissions [8].
The decarbonisation credentials of PV are, however, context-dependent. The carbon dioxide avoided by a PV installation is the product of the fossil-based energy it displaces and the emission factor of that displaced generation; both quantities must be established empirically rather than assumed [9,10]. Life-cycle assessment further shows that PV is not emission-free: manufacturing, chiefly silicon purification, carries an embodied burden that must be deducted to obtain a defensible net figure [11,12]. Published studies of Tanzanian PV frequently rely on nominal capacity factors or manufacturer yield figures, and comparatively few report measured, meter-level energy balances over a sustained operating period [4,13].
This paper addresses that gap by analysing continuous daily telemetry from an operating rooftop PV–battery system at a remote northern-Tanzanian site and translating the measured energy displacement into an avoided-emissions estimate under transparent, clearly bounded assumptions. The contributions are: (i) a measurement-based energy balance, including inferred system rating, specific yield and capacity factor; (ii) a two-scenario carbon-mitigation estimate that brackets grid and diesel displacement and nets life-cycle emissions; (iii) a multi-parameter sensitivity analysis that isolates the dominant assumption and bounds the influence of every other material assumption; and (iv) a benchmarking of the measured metrics against published field and review studies, including recent field evidence from sub-Saharan Africa published since 2022. The remainder of the paper is organised as follows. Section II reviews background and related work; Section III describes the site, system and materials; Section IV sets out the data and methodology; Section V presents results and discussion; and Section VI concludes.
The tanzanian power context
The Tanzanian interconnected system is operated principally by the national utility, TANESCO, and is dominated by hydropower and natural gas, with liquid-fuel plant and distributed diesel at the margin [3,14]. Transmission and distribution losses are high by international standards, and reserve margins are tight, so that displaced marginal generation in constrained periods is often the most carbon-intensive plant on the system [10]. In off-grid and weak-grid districts, of which Ngorongoro is representative, the practical alternative to solar is engine-generator plant, giving a displacement emission factor well above the grid average [3].
PV–Battery hybrids and self-consumption
The performance of a PV–battery hybrid is characterised by how much of the generated energy is used on-site (the self-consumption ratio) and how much of the load is met from solar and storage without import (the self-sufficiency ratio) [15]. Storage raises both figures by shifting midday surplus into the evening, at the cost of round-trip conversion losses of the order of 10–20% for lithium-ion systems [6,7]. Techno-economic studies for East-African sites using tools such as HOMER report renewable fractions that depend strongly on storage sizing and load profile [13,16], underlining the value of measured field data of the kind analysed here.
Carbon accounting for distributed PV
Avoided-emission accounting for distributed generation follows the location-based Scope 2 logic of the Greenhouse Gas Protocol [9], valuing displaced electricity at a grid or marginal emission factor drawn from recognised databases [10,17]. Clean Development Mechanism methodologies formalise the combined-margin approach for baseline emissions in renewable projects [18]. Harmonised life-cycle assessments place the embodied intensity of crystalline-silicon PV in the range of tens of grammes of CO₂ per kilowatt-hour [11,12], which is small relative to fossil displacement but non-negligible and is therefore retained in the present net figures.
Location and context
The installation is located at Wasso, in the Ngorongoro District of the Arusha Region, in northern Tanzania. The site is representative of a remote service centre lying beyond the reach of a reliable interconnected supply, where the local electrical load is otherwise served by, or supplemented by, engine-generator plant. This context matters for the analysis: the marginal generation displaced by the PV system is plausibly diesel-based rather than grid-average, and both possibilities are therefore carried through the emission calculation. The array is roof-mounted at Wasso village, Oloirien ward (approximately 2.06° S, 35.62° E; elevation ≈ 2 000 m a.s.l.), in a subtropical-highland climate; these coordinates fix the solar-resource lookup and transposition described in Section IV-B.
System configuration
The system is a rooftop PV array coupled through a hybrid inverter to a lithium-ion battery bank, operating alongside an external supply from which energy is imported when solar generation and stored energy are insufficient. The dispatch priority is load-first: PV energy serves the instantaneous load, then charges the battery, with export to the external supply enabled but negligible in practice. The single-line arrangement is shown in Figure 1. An integrated data logger records the daily energy quantities used in this study.
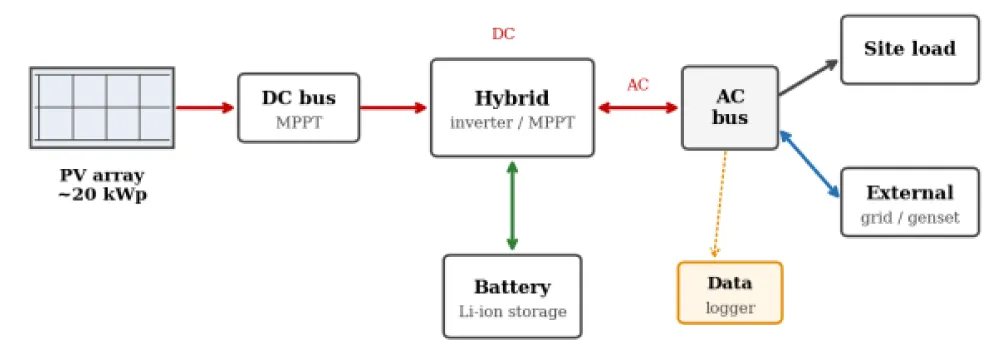
Figure 1: Single-line diagram of the monitored rooftop PV–battery hybrid system. Solid arrows denote power flow; the dotted arrow denotes metering by the data logger.
Materials and component summary
Table 1 summarises the principal components and their materials. The array rating is inferred from the production record (Section V-B) rather than read from a nameplate, and is stated as an estimate. The material composition is relevant to the life-cycle deduction applied in the carbon accounting: the dominant embodied burden originates in the crystalline-silicon modules, with smaller contributions from the steel mounting structure, copper conductors, the power-electronic inverter and the lithium-ion cells [11,12].
| Table 1: Principal components and materials. | ||
| Component | Material / type | Role |
| PV array (~20 kWp, est.) | Crystalline silicon | Solar generation |
| Mounting structure | Galvanised steel / Al | Roof fixing, tilt |
| Hybrid inverter | Power electronics | DC–AC, MPPT, control |
| Battery bank | Lithium-ion cells | Energy storage |
| DC / AC cabling | Copper | Conduction |
| Data logger | Embedded metering | Telemetry |
| External supply | Grid / diesel genset | Back-up import |
| Array rating inferred from production data; see Section V-B. | ||
Data acquisition, instrumentation and pre-processing
Daily-statistics records were exported from the plant monitoring portal for 1 December 2025 to 14 July 2026. Each record reports, for one calendar day, the on-site production, consumption, feed-in, energy purchased, and the energy charged to and discharged from the battery, in kilowatt-hours, together with a derived self-used ratio. The four exported workbooks were concatenated, duplicate dates removed and the series ordered chronologically, giving 215 daily records.
Inspection revealed two regimes. From 1 December 2025 to 18 January 2026 the recorded production stayed below 2 kWh/day with negligible battery activity, consistent with a pre-commissioning and instrumentation phase. From 20 January 2026 the production rose to tens of kilowatt-hours per day with regular battery cycling, indicating full operation. The analysis is therefore restricted to the 165-day operational window, 20 January to 14 July 2026; the earlier records are excluded so as not to distort the metrics.
The exclusion criterion is objective and reproducible: the pre-commissioning regime is defined by a recorded daily production at or below 2 kWh/day—more than an order of magnitude below the operational mean of 53.3 kWh/day and attributable to standby, self-test and instrumentation activity rather than useful generation—so that no operational day is at risk of exclusion and no threshold tuning is involved. The resulting record accounting is set out in Table 2. Of the 226 calendar days in the export window, 215 daily records survived concatenation and de-duplication; the 50 pre-commissioning records (1 December 2025 to 19 January 2026) were removed, leaving 165 operational records (20 January to 14 July 2026). The operational window itself spans 176 calendar days, so 11 days are absent from the portal export, reflecting brief data-logger or communication outages.
| Table 2: Record accounting and data treatment. | |
| Item | Value / treatment |
| Export window | 1 Dec 2025 – 14 Jul 2026 (226 calendar days) |
| Records after concatenation and de-duplication | 215 |
| Excluded: pre-commissioning (≤ 2 kWh/day) |
50 (1 Dec 2025 – 19 Jan 2026) |
| Retained: operational analysis window | 165 (20 Jan – 14 Jul 2026) |
| Operational calendar span | 176 days |
| Absent days within window (logger/comm. gaps) |
11; left as gaps, not interpolated |
| Duplicate dates | removed (later export retained) |
| Feed-in (export) channel | 0.06 kWh → set to zero within resolution |
| Energy-balance closure (independent check) |
7.4% |
| All exclusions applied before computing any reported metric; no gap-filling or imputation was used. | |
These gaps were left unfilled rather than interpolated or back-filled, because gap-filling would inject synthetic energy into the very quantities on which the emission estimate rests; consequently the reported period totals are sums over recorded days only, and every mean-daily and annualised metric divides by the 165 recorded days. This treatment is mildly conservative for the cumulative totals—had the 11 absent days generated at the operational mean they would have added roughly 590 kWh, about 7%, to the window production—while leaving the per-day rates, and hence the avoided-emission rate on which the projections depend, unbiased. Days on which any single energy channel was missing were excluded pairwise rather than partially imputed, and where duplicate dates arose from overlapping workbook exports the later record was retained.
All exclusions applied before computing any reported metric; no gap-filling or imputation was used.
All energy quantities are recorded by the metering integrated in the hybrid inverter and its data logger, which totalises AC active energy at each measurement node (production, load, import and feed-in) and reports daily cumulative values to the monitoring portal at a resolution of 0.01 kWh. The active-energy channels conform to the accuracy requirements of IEC 62053-21/-22 for static a.c. meters [26]; a Class 1 specification (±1% of reading over the rated range) is assumed for the revenue channels, with a conservative ±2% applied where the inverter-integrated measurement is not independently calibrated. Daily totals are therefore taken to carry a relative uncertainty of the order of ±1–2%.
The feed-in (export) channel warrants particular scrutiny because it enters the displaced-energy term (1) directly. Over the 165-day window the cumulative recorded feed-in was 0.06 kWh, which is of the order of the 0.01 kWh logging resolution and far below the ±1–2% uncertainty of the production total (≈ ±90–180 kWh). Export is thus not statistically distinguishable from zero, and E_exp is set to zero within measurement uncertainty, so that the displaced energy equals the production, E_disp ≈ E_PV. As an independent consistency check, the metered energy balance—production plus import against served load plus conversion and storage losses—closes to within 7.4% (Section V-A), commensurate with the combined metering uncertainty and the expected inverter and storage losses.
Solar-resource characterisation
A calibrated plane-of-array pyranometer was not installed at the site during the reporting window, so on-site irradiance was not logged. The solar resource is instead characterised from validated satellite-derived databases interrogated at the site coordinates: the Global Solar Atlas (Solargis model) and the PVGIS long-term data, cross-checked against the NASA POWER reanalysis [23-25]. For this location these sources give a long-term annual global horizontal irradiation of approximately 2 050 kWh/m²/yr (about 5.6 kWh/m²/day) and, at the array tilt, an in-plane irradiation of the order of 2 100 kWh/m²/yr.
The Global Solar Atlas validation reports a yearly-GHI model uncertainty of about ±4–8% for sites of this type, to which the horizontal-to-tilt transposition adds a few further per cent; the plane-of-array insolation used below is accordingly assigned a combined uncertainty of about ±8%. Because these are modelled rather than on-site measured values, they are used only to derive the equivalent peak-sun-hours entering the array-rating inference (Section IV-D) and to contextualise the specific yield; they are not used to compute the avoided emissions, which rest solely on metered energy. A secondary-standard on-site pyranometer (ISO 9060 class) is being commissioned to replace the modelled resource with logged, instrument-validated irradiance and to permit a measured performance ratio in future work.
Performance metrics
The PV energy consumed on-site, which displaces external generation, is E_disp = E_PV − E_exp (1)
with E_PV the production and E_exp the feed-in. The self-consumption and self-sufficiency ratios are
SCR = (E_PV − E_exp) / E_PV (2)
SSR = (E_load − E_imp) / E_load (3)
where E_load is consumption and E_imp is energy purchased. The inferred battery round-trip efficiency is
η_rt = E_dis / E_chg (4)
With an inferred array rating P_STC, the specific (final) yield and capacity factor over an annualised year are
Y_f = E_PV,ann / P_STC (5)
CF = E_PV,ann / (P_STC × 8760) (6)
Array-rating methodology
Because the array nameplate is not reported in the telemetry, the installed DC rating is inferred from the production record under a transparent, reproducible procedure. Clear-sky days are identified as those whose daily production lies in the upper envelope of the distribution and exceeds 95% of the observed maximum, isolating days on which output is resource- rather than load- or curtailment-limited; the peak clear-day production over the window is E_peak = 102.1 kWh. The plane-of-array insolation on such days, expressed as equivalent peak-sun-hours, is H_POA = 6.0–6.2 h, taken from the satellite resource of Section IV-B. With a performance ratio PR representing the aggregate of temperature, soiling, wiring, inverter and mismatch losses, the rating follows from
P_STC = E_peak / (H_POA × PR) (7)
A performance ratio PR = 0.78–0.82 is adopted, consistent with well-ventilated fixed-tilt rooftop systems at this altitude and ambient temperature, and with the
(ΔP/P)² = (ΔE_peak/E_peak)² + (ΔH_POA/H_POA)² + (ΔPR/PR)² (8)
with ΔE_peak/E_peak ≈ 2%, ΔH_POA/H_POA ≈ 8% and ΔPR/PR ≈ 5%, yields a combined rating uncertainty of about ±10%, i.e. 20 ± 2 kWp. The specific yield and capacity factor derived from this rating through (5)–(6) inherit the same uncertainty and are order-of-magnitude indicators pending nameplate confirmation; crucially, the rating does not enter the avoided-emissions calculation, which depends only on the metered displaced energy.
Carbon-accounting and life-cycle assessment framework
Gross avoided emissions value the displaced energy at the carbon intensity of the generation it replaces:
C_gross = E_disp × EF_disp (9)
Netting the embodied life-cycle emissions of the PV chain through an energy-specific factor EF_LC gives
C_net = E_disp × ( EF_disp − EF_LC ) (10)
Two displacement scenarios are carried through. In the grid scenario EF_disp = 0.53 kgCO₂/kWh, a representative operating value for the hydro- and gas-dominated Tanzanian system with liquid-fuel plant at the margin, within the range compiled in standard databases [10,17,18]. In the diesel scenario, appropriate to the remote site, EF_disp = 0.80 kgCO₂/kWh, a conventional value for small generating sets [3]. The life-cycle factor is EF_LC = 0.048 kgCO₂/kWh, consistent with harmonised assessments of crystalline-silicon PV [11,12]. Annualised figures scale the measured mean daily displaced energy by 365 days; lifetime figures assume a 25-year service life with a 6% aggregate derating for degradation and availability [19].
The life-cycle factor EF_LC deserves explicit specification. The assessment follows the ISO 14040/14044 framework and the IEA PVPS Task 12 methodology for photovoltaic systems [27,29]. The functional unit is one kilowatt-hour of electricity generated by the array over its service life, and the system boundary is cradle-to-grave, comprising raw-material extraction and silicon purification, cell and module manufacture, the balance-of-system (mounting, cabling and inverter), transport, installation, operation and maintenance, and end-of-life treatment. The embodied burden is dominated by the crystalline-silicon modules, chiefly the energy-intensive silicon purification and wafering stages, with smaller contributions from the aluminium and steel mounting, the copper conductors and the power-electronic inverter.
The energy-specific factor is obtained by amortising the total embodied greenhouse-gas burden G_LC over the lifetime generation,
EF_LC = G_LC / ( E_ann × N_life ) (11)
with E_ann the annual generation and N_life the service life. The adopted value EF_LC = 0.048 kgCO₂-eq/kWh (48 gCO₂-eq/kWh) is taken from the harmonised crystalline-siliconassessment of Hsu et al. [28], whose harmonised median is 45 gCO₂-eq/kWh with an interquartile range of 39–49 gCO₂-eq/kWh (reference conditions 1 700 kWh/m²/yr, 30-year life, PR 0.75–0.80), and is consistent with the IEA PVPS Task 12 figure of about 43 gCO₂-eq/kWh for a modern mono-crystalline rooftop system [28,29]. The value is deliberately conservative: it sits at the upper end of the harmonised range, and because the Wasso in-plane irradiation (≈ 2 100 kWh/m²/yr) exceeds the 1 700 kWh/m²/yr harmonisation reference, the true site-specific per-kWh intensity is lower, so the net mitigation reported here is, if anything, understated. The parameters, boundaries, assumptions and sources are collected in (Table 3).
| Table 3: Life-cycle assessment specification. | ||
| Parameter | Value / assumption | Basis / source |
| Framework | ISO 14040/14044; IEA PVPS Task 12 | [27,29] |
| Functional unit | 1 kWh generated over service life | [29] |
| System boundary | Cradle-to-grave (incl. BOS, EOL) | [29] |
| Components | c-Si modules (dominant), mounting, inverter, cabling | [11,29] |
| Harmonised c-Si intensity | 45 gCO₂-eq/kWh (IQR 39–49) | [28] |
| Modern mono-Si reference | ≈ 43 gCO₂-eq/kWh | [29] |
| Adopted EF_LC | 0.048 kgCO₂-eq/kWh (conservative) | this study |
| Harmonisation irradiation | 1 700 kWh/m²/yr | [28] |
| Site in-plane irradiation | ≈ 2 100 kWh/m²/yr | [23–25] |
| Service life / derating | 25 yr / 6% aggregate | [19] |
| Battery embodied | tens of gCO₂-eq/kWh throughput (excl. EF_LC; sensitivity) | [12,29] |
| BOS: Balance of System; EOL: End Of Life; IQR: Interquartile Range. | ||
The harmonised factor covers the PV generation chain (modules and balance-of-system) but not the lithium-ion battery, whose embodied emissions of the order of tens of gCO₂-eq per kWh of throughput apply to the stored fraction rather than to directly generated energy; their effect on the net figures is second-order and is examined in the sensitivity analysis (Section V-E) and limitations (Section V-H).
Uncertainty quantification
The uncertainty in the reported avoided emissions is dominated not by the metered energy but by the choice of displacement emission factor. Following the GUM approach [30], the relative uncertainty in the net avoided emissions combines the metering, emission-factor and life-cycle contributions in quadrature,
(ΔC_net/C_net)² = (ΔE_disp/E_disp)² + (ΔEF_disp/EF_disp)² + (ΔEF_LC/EF_LC)² (12)
The metered displaced energy contributes only ΔE_disp/E_disp ≈ 1–2%; the life-cycle factor, at ±20% of a term that is itself under one-tenth of EF_disp, contributes under 2%; the displacement factor dominates. Rather than assign a single symmetric uncertainty to EF_disp, the analysis brackets it with the two physically distinct scenarios—grid at 0.53 and diesel at 0.80 kgCO₂/kWh—which span the plausible range for this weak-grid, genset-backed site. Within each scenario the residual uncertainty is of the order of ±10%, so the net avoided emissions are 4.2 ± 0.4 tCO₂ (grid) and 6.6 ± 0.7 tCO₂ (diesel) over the window, the scenario choice accounting for the larger, clearly reported spread. Because the estimate is anchored to measured energy and an explicitly bracketed emission factor, the inferred array rating and the modelled irradiance—each carrying larger uncertainty—do not propagate into it.
Energy performance
Over the 165-day operational window the system produced 8 797 kWh, at a mean daily yield of 53.3 kWh and a peak daily yield of 102.1 kWh. Consumption over the same period was 14 739 kWh and energy purchased was 7 125 kWh. Feed-in was negligible at 0.06 kWh, so from (2) the self-consumption ratio is effectively 100%: essentially all generated energy was retained on-site through direct supply and battery buffering. The battery accumulated 3 133 kWh of charge and delivered 2 485 kWh of discharge, giving from (4) an inferred round-trip efficiency of 79.3%, typical of a well-utilised lithium-ion bank at daily resolution. The overall energy balance closes to within 7.4%, the residual representing inverter and storage conversion losses (Figure 2).
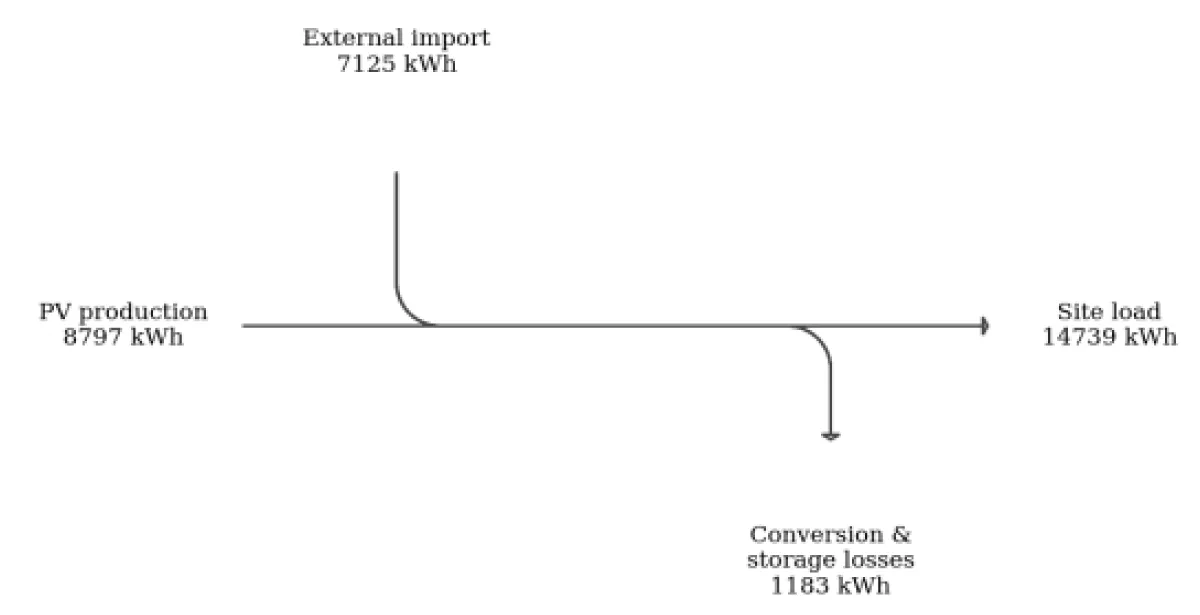
Figure 2: Energy-flow (Sankey) diagram of the aggregate balance over the operational period. Inputs are PV production and external import; outputs are the served load and conversion/storage losses.
Figure 3 shows the daily evolution of production, consumption and import. Production is variable day-to-day, reflecting cloud cover and seasonal irradiation, while consumption exhibits larger swings characteristic of a small load with intermittent high-power activity. Grid import tracks the shortfall, contracting on high-yield days and expanding when generation is low. The statistical spread of daily production is summarised in Figure 4: the histogram is broad, and the duration curve shows that production exceeds 60 kWh on roughly 40% of days while falling below 30 kWh on about a quarter, underlining the variability that storage and the external supply together buffer.
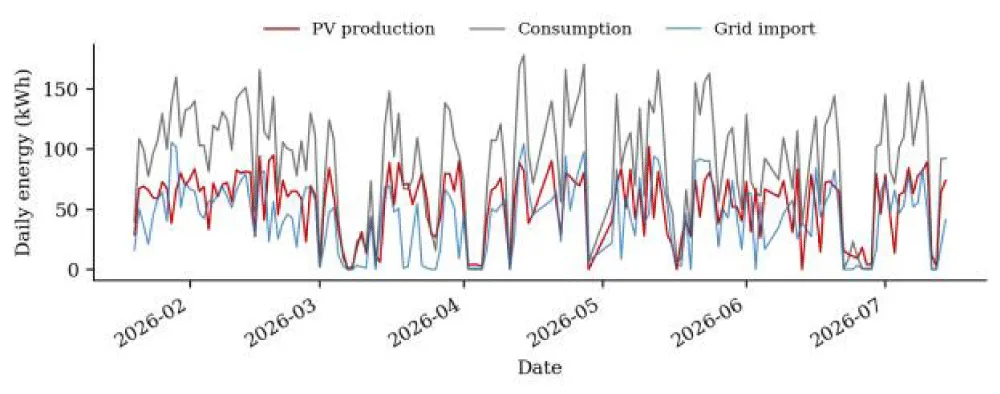
Figure 3: Daily PV production, site consumption and grid import over the 165-day operational period.
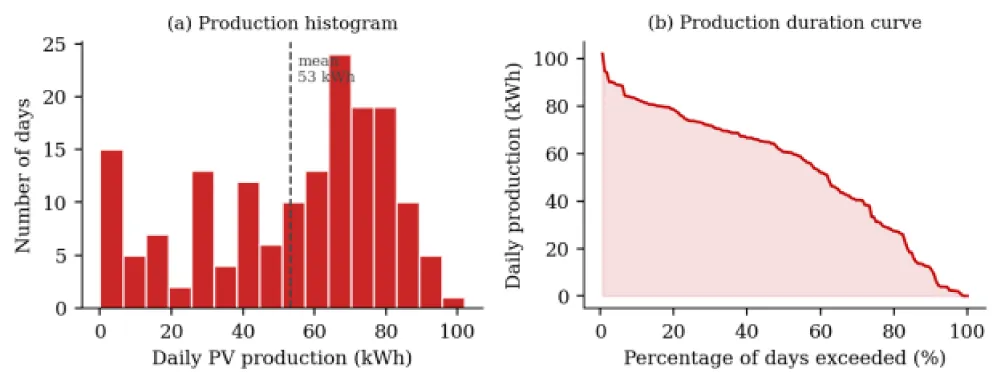
Figure 4: Distribution of daily PV production: (a) histogram; (b) production duration curve.
Inferred system rating
The array rating is not recorded in the telemetry and is inferred from the peak clear-day production of 102.1 kWh. Assuming 6.0–6.2 peak-sun-hours and a performance ratio of 0.78–0.82, equations (7)–(8) of Section IV-D place the array at approximately 20–23 kWp; a central value of 20 kWp is adopted. On this basis the annualised production of 19 460 kWh implies a specific yield near 970 kWh/kWp/yr and a capacity factor of about 11%, both consistent with fixed-tilt PV at this latitude and irradiation [4]. These inferred figures should be read as order-of-magnitude indicators pending nameplate confirmation, and are collected with the measured metrics in Tables 4,5.
| Table 4: Monthly energy summary (Operational period). | |||||
| Month | Prod. | Cons. | Import | Disch. | Mean/d |
| 2026-01¹ | 744 | 1 299 | 662 | – | 62.0 |
| 2026-02 | 1 852 | 3 176 | 1 537 | – | 66.2 |
| 2026-03 | 1 482 | 2 077 | 754 | – | 47.8 |
| 2026-04 | 1 228 | 2 214 | 1 153 | – | 49.1 |
| 2026-05 | 1 541 | 2 761 | 1 459 | – | 53.1 |
| 2026-06 | 1 137 | 1 850 | 892 | – | 43.7 |
| 2026-07¹ | 813 | 1 363 | 668 | – | 58.1 |
| Total | 8 797 | 14 739 | 7 125 | 2 485 | 53.3 |
| All values in kWh except mean/day (kWh/day). ¹Partial month. | |||||
| Table 5: Summary of measured and inferred metrics. | |
| Metric | Value |
| Operational days | 165 |
| PV production | 8 797 kWh |
| Consumption | 14 739 kWh |
| Grid import | 7 125 kWh |
| Feed-in (export) | 0.06 kWh |
| Mean / peak daily yield | 53.3 / 102.1 kWh |
| Self-consumption ratio | ≈ 100% |
| Self-sufficiency ratio | 51.7% |
| Battery round-trip eff. | 79.3% |
| Array rating (inferred) | ≈ 20 kWp |
| Specific yield (ann.) | ≈ 970 kWh/kWp/yr |
| Capacity factor | ≈ 11% |
| Inferred quantities per Section V-B. | |
Energy balance and self-sufficiency
Applying (3), the site met 51.7% of its total demand from solar generation and stored energy without importing, the remaining 48.3% being purchased. The portal’s own self-used ratio averaged about 62%, confirming that the majority of solar output was absorbed locally. The monthly picture (Figure 5) shows production highest in the drier high-irradiation months and softening through the long-rains period from March to June before recovering in July, with import moving inversely. Monthly self-sufficiency (Figure 6) is correspondingly highest early in the record.
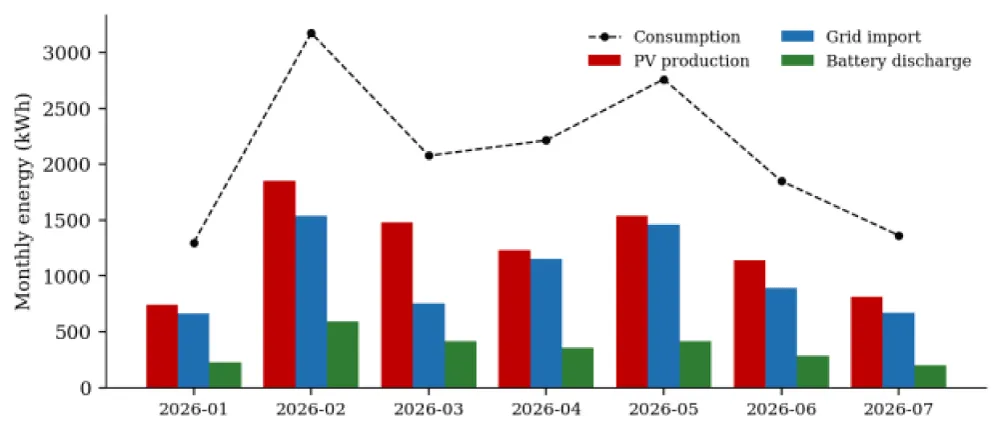
Figure 5: Monthly PV production, grid import and battery discharge against site consumption. Partial months (January and July) reflect the operational start date and the data-export cut-off.
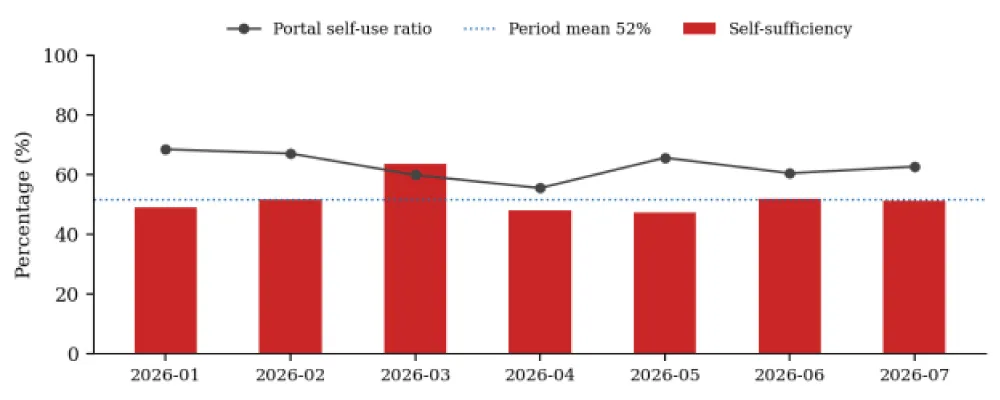
Figure 6: Monthly self-sufficiency and portal self-use ratio, with the period-mean self-sufficiency.
Avoided carbon emissions
Because feed-in was negligible, the displaced energy from (1) equals the production, E_disp ≈ 8 797 kWh. Substituting into (9)–(10) gives the figures in Table 6. Under grid displacement the system avoided 4.66 t of CO₂ gross and 4.24 t net; under diesel displacement, more representative of the site, 7.04 t gross and 6.62 t net. The monthly breakdown (Figure 7) follows production, and the cumulative net trajectories for both scenarios are shown in Figure 8. With the propagated uncertainty of Section IV-F, the net figures are 4.2 ± 0.4 t (grid) and 6.6 ± 0.7 t (diesel) over the window.
| Table 6: Avoided CO₂ under two displacement scenarios. | ||
| Basis | Grid (0.53) | Diesel (0.80) |
| 165-day gross | 4.66 t | 7.04 t |
| 165-day net | 4.24 t | 6.62 t |
| Annualised net | 9.4 t/yr | 14.6 t/yr |
| 25-yr net | ≈ 220 t | ≈ 344 t |
| Emission factors in kgCO₂/kWh. Net figures deduct 0.048 kgCO₂/kWh life-cycle emissions. | ||
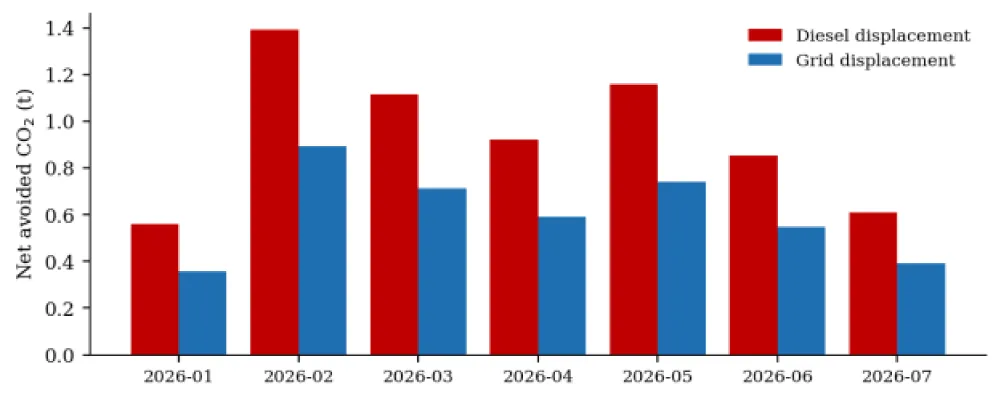
Figure 7: Monthly net avoided CO₂ under the grid- and diesel-displacement scenarios.
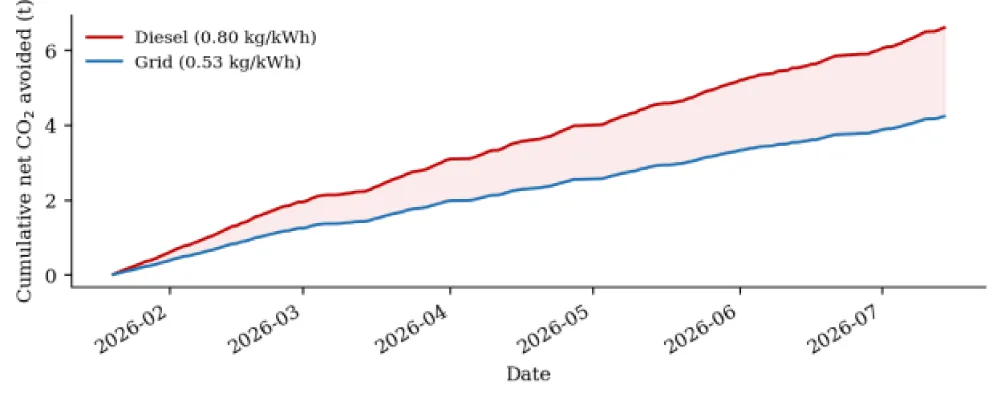
Figure 8: Cumulative net avoided CO₂ over the operational period; the shaded band spans the two displacement scenarios.
Scaling the measured mean daily displacement to a full year gives an annualised net mitigation of 9.4 tCO₂/yr (grid) to 14.6 tCO₂/yr (diesel). Over an assumed 25-year life with 6% derating, cumulative net mitigation is of the order of 220 t and 344 t respectively—substantial for an installation of this modest scale, and accruing steadily across the whole service life rather than being confined to the payback period.
Sensitivity analysis
The estimate is most sensitive to the displacement emission factor. Figure 9 shows annualised net mitigation as a function of EF_disp across 0.30–1.00 kgCO₂/kWh: the relationship is linear, and the 0.53–0.80 range adopted here accounts for the roughly 55% spread between the two scenarios. The life-cycle deduction is comparatively minor: at 0.048 kgCO₂/kWh it reduces the gross figure by under 10% and would not alter the qualitative conclusion even if doubled. The inferred array rating affects only the derived specific-yield and capacity-factor indicators, not the avoided-emissions estimate, which rests solely on measured displaced energy.
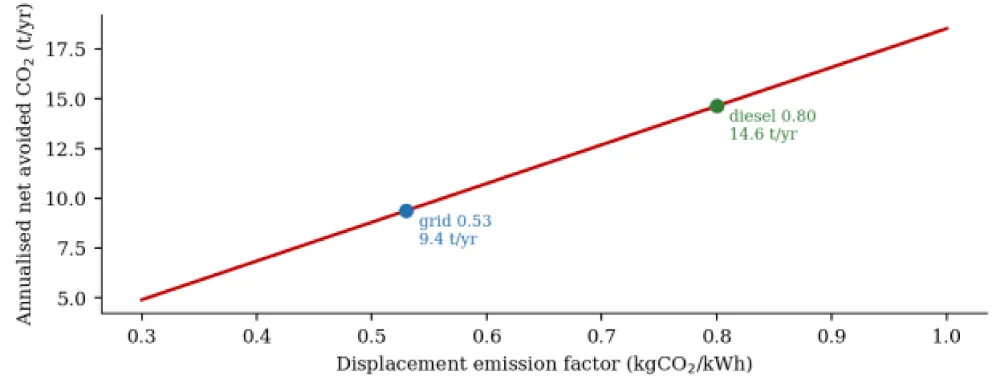
Figure 9: Sensitivity of annualised net avoided CO₂ to the displacement emission factor, with the grid and diesel cases marked.
The dominance of the displacement factor is confirmed by a one-at-a-time (OAT) sensitivity analysis in which every material assumption is varied across its plausible range while the remainder are held at baseline; the outcomes are collected in Table 7. Two features stand out. First, the estimate is structurally robust to the assumptions that carry the largest individual uncertainty—the inferred array rating and the modelled irradiance—because these enter only the derived specific-yield and capacity-factor indicators and are fully decoupled from the metered displaced energy that drives the emissions, so that a ±10% error in the rating moves the avoided-emission figure by exactly zero. Second, among the assumptions that do affect the emissions, only two are of first order: the displacement factor, deliberately reported as a bracketed grid–diesel range rather than a point value, and the seasonal representativeness of the 165-day window, which scales the annualised and lifetime figures linearly and is bounded here at about ±10% because the record already spans both the drier high-irradiation months and the long-rains trough.
| Table 7: One-at-a-time sensitivity of annualised net avoided CO₂. | |||
| Assumption | Baseline | Range examined | Effect on annualised net |
| Displacement factor EF_disp (dominant) | 0.53 / 0.80 | 0.30–1.00 kgCO₂/kWh | 4.9–18.5 t/yr; defines reported range |
| Life-cycle factor EF_LC | 48 gCO₂/kWh | 39–96 (IQR→doubled) | ≤ 10% (grid); ≤ 7% (diesel) |
| Battery embodied (stored fraction) | 0 (excluded) | 20–40 gCO₂/kWh throughput | −1 to −2% |
| Performance ratio / inferred rating | 0.80 / 20 kWp | ±10% | 0% (decoupled); Yf, CF ±10% |
| Seasonal annualisation (165 d → yr) | representative | ±10% | ±10% (linear) |
| Lifetime degradation / derating | 0.5%/yr agg. | 0.5–1.0%/yr | ≤ 6% (25-yr total only) |
| Missing-day treatment (11 gaps) | no interpolation | gaps = 0 vs mean | 0% on rate; ≤ +7% window total |
| OAT: one-at-a-time. Percentage effects are relative to the scenario baselines (grid 9.4, diesel 14.6 tCO₂/yr). Yf: specific yield; CF: capacity factor. | |||
Every remaining assumption is second-order. The life-cycle factor changes the net figure by under 10% even if doubled; adding the omitted battery-embodied emissions to the stored fraction reduces the net by only 1–2%; and a more aggressive 25-year degradation assumption (1.0%/yr rather than the baseline 0.5%/yr aggregate) trims the lifetime total by at most 6%, with no effect on the window or annual figures. The treatment of the 11 missing days is likewise immaterial: because the mean-daily basis normalises to recorded days, it leaves the avoided-emission rate unbiased and affects only the cumulative window total, and then by at most 7%. The qualitative conclusion—material, measured mitigation governed by the displacement-factor choice—is therefore insensitive to every secondary modelling assumption.
Comparison with published studies
To place the measured performance in context, the principal metrics are benchmarked in Table 8 against values reported in field studies and systematic reviews. The carbon-accounting outputs align closely with the literature: the net life-cycle intensity of 48 gCO₂-eq/kWh sits at the conservative upper edge of the harmonised crystalline-silicon median of 45 gCO₂-eq/kWh (interquartile range 39–49) and the IEA PVPS reference of about 43 gCO₂-eq/kWh [28,29], while the avoided-emission intensity of 0.47–0.73 tCO₂/kWp/yr falls within the 0.4–1.0 tCO₂/kWp/yr band reported for rural sub-Saharan PV–battery installations displacing a mix of grid and diesel generation [20]. The self-sufficiency of 51.7% and the near-total self-consumption are consistent with the storage-enabled load-matching literature, in which batteries raise self-consumption by 20–50 percentage points over the roughly 35% typical of unstored residential PV and self-sufficiency by 12.5–30 points [15,31]; the self-consumption approaching 100% here is at the upper limit of that range because the weak-grid, genset-backed site offers no meaningful export path, so essentially all surplus is stored rather than spilled.
| Table 8: Comparison of Key Metrics with Published Values | |||
| Metric | This study (Wasso) | Reported in literature | Source |
| Specific yield (kWh/kWp/yr) | ≈ 970 (utilisation-limited) | 1 405–1 880 (resource-limited, TZ) | [4,23] |
| Capacity factor | ≈ 11% | ≈ 16–20% (resource-limited) | [4] |
| Self-consumption ratio | ≈ 100% | ≈ 35% PV-only; +20–50 pp w/ storage | [15,31] |
| Self-sufficiency ratio | 51.7% | +12.5–30 pp over PV-only | [15,31] |
| Battery round-trip eff. | 79.3% (daily, AC-side) | 84–90% (system-level Li-ion) | [6,7] |
| Avoided emissions (tCO₂/kWp/yr) | 0.47–0.73 | ≈ 0.4–1.0 (rural SSA PV–battery) | [20] |
| PV life-cycle intensity (gCO₂/kWh) | 48 (conservative) | 45 (IQR 39–49); ≈ 43 | [28,29] |
| TZ: Tanzania; SSA: sub-Saharan Africa; pp: percentage points. | |||
kWh/kWp/yr resource-limited yield expected for fixed-tilt PV at this irradiation in Tanzania [4,23], and the corresponding capacity factor of about 11% lies below the 16–20% the resource would support. This divergence is not a performance defect but a direct consequence of the load-following, self-consumption-limited operation evidenced elsewhere in the record: with the battery frequently reaching full charge on high-irradiation, low-load days and with no economic export path, the inverter curtails surplus production, so the period-average yield reflects utilised rather than available energy. The peak clear-day production of 102.1 kWh, recorded on days when on-site load absorbed the full output, anchors the array-rating inference at the resource-limited level (Section V-B) and confirms that the depressed average yield is a utilisation effect rather than a resource or hardware shortfall. Because the avoided-emission estimate is built from metered displaced energy rather than from potential generation, this curtailment is already fully and conservatively reflected in the reported figures and introduces no upward bias. The inferred round-trip efficiency of 79.3%, marginally below the 84–90% typical of system-level lithium-ion storage [6,7], is consistent with a value derived from daily AC-side charge and discharge totals, which absorb standby, balance-of-system and battery-management consumption that finer-resolution metering would resolve separately.
Comparison with studies published since 2022
The benchmarks of Section V-F are drawn largely from established reviews and harmonisation studies. Because measured field evidence for PV–battery systems in sub-Saharan Africa has expanded appreciably in the last four years, the present findings are additionally compared in Table 9
| Table 9: Comparison with field and assessment studies published since 2022. | |||
| Study (year, setting) | System / method | Reported outcome | Relation to this study |
| Wassie & Ahlgren [32] (2023, Ethiopia) | 375 kWp off-grid PV–battery; IEC 61724 metrics | PR_corr 42%; output 46.6% below design; load shedding | Inverse case: shortfall from under-sizing, not curtailment |
| Adu-Poku et al. [33] (2023, Ghana) | Five island mini-grids; IEC TS 61724-3 loggers | PR 25–45%; unused (spilled) losses a principal loss channel | Corroborates curtailment as the cause of depressed yield |
| Wassie & Ahlgren [34] (2023, rural Africa) | Capacity-expansion planning under demand growth | Utilisation governed by PV–storage–demand co-evolution | Supports load growth to convert curtailment into displacement |
| Gutsch & Leker [35] (2022, review) | LCA of residential battery storage | 9–135 gCO₂-eq per kWh of lifetime electricity stored | Bounds the omitted battery term; consistent with ≤ 2% effect |
| Pfeifroth et al. [36] (2024, Meteosat region) | SARAH-3 satellite climate data record | ≈ 5 W/m² deviation from surface reference (monthly) | Supports satellite resource use pending on-site pyranometer |
| Kakou et al. [37] (2025, Côte d’Ivoire) | Multi-timescale validation of GHI products | Accuracy varies markedly with averaging timescale | Justifies the ±8% resource uncertainty adopted here |
| PR: performance ratio; PR_corr: temperature-corrected performance ratio; GHI: global horizontal irradiance. | |||
with studies published since 2022, which provide the closest methodological and geographical analogues to this work.
The most directly comparable recent study is that of Wassie and Ahlgren [32], who applied IEC 61724 performance metrics to a 375 kWp off-grid PV–battery mini-grid in southern Ethiopia and found a temperature-corrected performance ratio of 42% and a delivered output some 46.6% below the design expectation, with the deficit traced to under-sizing of the array and battery relative to a rapidly growing demand, obliging sustained load shedding. That result is instructive precisely because it is the inverse of the Wasso case. Both systems return a specific yield well below the resource-limited expectation, but the mechanisms are opposite: in the Ethiopian case the generating capacity was too small to meet the load, whereas at Wasso the array and storage are large relative to a modest load, so surplus energy is curtailed rather than shed to consumers. The practical implication differs accordingly—capacity expansion is the remedy in the former case, demand growth or productive-use load in the latter—and the distinction is only visible where, as in both studies, metered rather than modelled energy is analysed.
The Ghanaian assessment of Adu-Poku, et al. [33], which instrumented five island mini-grids on the Volta Lake in accordance with IEC TS 61724-3, reinforces the interpretation advanced in Section V-F. They report performance ratios of 25–45% and attribute the shortfall not only to battery and distribution inefficiencies but explicitly to unused losses, that is, to generation spilled because it could be neither consumed nor stored. The identification of curtailment as a principal loss channel in operating African mini-grids provides independent, recent support for attributing the depressed Wasso yield to utilisation rather than to a resource or hardware defect. Wassie and Ahlgren [34] extend the argument prospectively, showing that the utilisation of an operating mini-grid is governed by the co-evolution of generation capacity, storage and demand; on that basis the curtailed energy at Wasso represents a reserve of displacement potential that would be realised, without additional generating capacity, by connecting further load.
Recent work also tightens the treatment of the two assumptions this study could not measure directly. Gutsch and Leker [35], in the first systematic review of life-cycle assessments of residential battery storage, place the greenhouse-gas burden at 9–135 gCO₂-eq per kilowatt-hour of lifetime electricity stored, a range that bounds the battery term omitted from EF_LC and confirms the second-order effect estimated in Table 7. On the resource side, the SARAH-3 climate data record documented by Pfeifroth, et al. [36] reports deviations of about 5 W/m² from surface reference measurements for monthly irradiance, while Kakou, et al. [37] show for a tropical West-African site that satellite-product accuracy varies markedly with averaging timescale, being appreciably better for monthly than for hourly values. Together these support the use of satellite-derived resource data for the monthly-to-annual contextualisation performed here, while confirming that they are not a substitute for on-site measurement at the sub-daily resolution needed for a formal performance-ratio evaluation.
Finally, the recent literature clarifies the significance of the result beyond the site. Tanzania’s Nationally Determined Contribution commits the country to substantial economy-wide emission reductions by 2030, with the energy sector among the principal abatement pathways [21]. Measured, verifiable mitigation at the level of the individual installation—0.47–0.73 tCO₂/kWp/yr here—is the quantity that aggregates into such national inventories, and the transparent energy-balance-to-emissions procedure demonstrated in this paper offers a template for the monitoring, reporting and verification that credible national accounting requires.
Comparison with Field and Assessment Studies Published Since 2022
Limitations
Four limitations qualify the results, and each is stated below together with the foundational and the most recent evidence bearing on it. First, the annualised and lifetime projections assume the measured 165-day mean daily yield is representative of the full year. Because the window spans both the drier high-irradiation months and the long-rains period, the assumption is reasonable, and Table 7 bounds its influence at about ±10%, but a 165-day record cannot resolve interannual variability. Long-term irradiation databases were developed precisely to characterise that variability [24], and the four-decade SARAH-3 climate data record now provides a homogeneous basis for it across the Meteosat field of view, including East Africa [36]; a full annual campaign cross-referenced to such a record would replace the assumption with a measurement.
Second, the array rating and performance ratio are inferred rather than measured, and the solar resource is characterised from satellite databases rather than an on-site pyranometer, so the rating carries an estimated ±10% uncertainty. The satellite products used are validated to a stated accuracy [23], and recent multi-timescale validation confirms that their skill is timescale-dependent, being adequate for the monthly-to-annual contextualisation performed here but weaker at the sub-daily resolution [37]. That a rigorous performance-ratio evaluation requires on-site instrumentation is demonstrated by Wassie and Ahlgren [32], who obtained a temperature-corrected performance ratio for a comparable African system only from logged plant-level measurements to IEC 61724; the secondary-standard pyranometer now being commissioned is intended to place the present system on the same footing.
Third, the embodied emissions of the lithium-ion battery are excluded from EF_LC. The principle that the full supply chain, and not the generating plant alone, must be counted in any life-cycle comparison of electricity technologies is long established [22], and the omission is retained here only because the harmonised photovoltaic factor adopted does not cover storage. Its magnitude is nevertheless bounded by recent evidence: Gutsch and Leker [35] report 9–135 gCO₂-eq per kilowatt-hour of lifetime electricity stored for residential battery systems, which, applied to the 2 485 kWh discharged over the window, corresponds to 0.02–0.34 tCO₂-eq; over the central part of that range the effect is the 1–2% quantified in Table 7, and even at the extreme upper bound it reaches only about 8% of the net figure, altering no conclusion.
Fourth, daily-resolution totals are appropriate for carbon accounting, since the avoided emissions depend only on aggregate displaced energy, but they cannot resolve sub-daily dispatch. The sensitivity of load-matching metrics to time resolution is well documented [15], and the recent instrumented assessment of Adu-Poku, et al. [33] shows that logging to IEC TS 61724-3 separates battery, distribution and unused losses that daily totals necessarily aggregate. Higher-resolution logging would therefore permit direct measurement of the curtailment inferred in Section V-F, rather than its inference from the near-zero export and the depressed specific yield.
This paper presented a measurement-based assessment of carbon-emission mitigation by a rooftop PV–battery hybrid system at a remote site in Ngorongoro, Tanzania, using 165 days of daily telemetry. The system, inferred at approximately 20 kWp, generated 8 797 kWh at a specific yield near 970 kWh/kWp/yr, retained essentially all of it on-site, and met 51.7% of local demand without importing energy, at an inferred storage round-trip efficiency of 79.3%. Valuing the displaced energy at 0.53–0.80 kgCO₂/kWh and netting embodied life-cycle emissions, the installation avoided 4.24–6.62 tCO₂ over the window, equivalent to 9.4–14.6 tCO₂/yr and to roughly 220–344 t across a 25-year life.
The results confirm that even a small hybrid PV system delivers material and verifiable decarbonisation in a remote East-African setting, and that correct storage sizing—evidenced here by near-zero export—is central to that benefit. The measured metrics are shown to fall within the ranges reported by comparable field and review studies, with the sole divergence—a specific yield below the resource-limited expectation—explained by self-consumption-limited curtailment and immaterial to the metered avoided-emission result (Section V-F) and corroborated by recent instrumented studies of African mini-grids (Section V-G). The transparent energy-balance-to-emissions methodology is directly transferable to the assessment of comparable systems and to competency-based renewable-energy teaching. Future work will extend the record to a full calendar year, log plane-of-array irradiation for a formal performance-ratio evaluation, confirm the nameplate rating, and analyse sub-daily dispatch to further characterise storage performance.
Acknowledgment
The authors thank Arusha Technical College for institutional support, and the operator of the Wasso installation for access to the monitoring data.
- International Energy Agency. Africa energy outlook 2022. Paris: IEA; 2022.
- National solar resource 5–6 kWh/m²/day; electrification ≈33% national, ≈17% rural. 2025.
- Szabó S, Bódis K, Huld T, Moner‑Girona M. Energy solutions in rural Africa: mapping electrification costs of distributed solar and diesel generation. Environ Res Lett. 2011;6(3). Available from: https://dx.doi.org/10.1088/1748-9326/6/3/034002
- Mbwambo AK, et al. Solar resource and PV yield assessment for northern Tanzania. Renew Energy. 2023;
- International Renewable Energy Agency. Renewable power generation costs in 2023. Abu Dhabi: IRENA; 2024. Global average utility‑scale PV LCOE USD 0.044/kWh.
- May GJ, Davidson A, Monahov B. Lead batteries for utility energy storage: a review. J Energy Storage. 2018;15:145‑57.
- Hannan MA. Review of energy storage systems for electric vehicle applications: issues and challenges. Renew Sustain Energy Rev. 2017;69:771‑89.
- Intergovernmental Panel on Climate Change. Climate change 2022: mitigation of climate change. Cambridge (UK): Cambridge Univ Press; 2022.
- World Resources Institute, WBCSD. GHG protocol scope 2 guidance. Washington (DC): WRI; 2015.
- International Energy Agency. Emissions factors 2025. Paris: IEA; 2025. [Country grid CO₂ emission factors for Scope 2 accounting].
- IPCC. Annex III: technology‑specific cost and performance parameters. In: Climate change 2014: mitigation of climate change. Cambridge (UK): Cambridge Univ Press; 2014.
- Alrbai M, AlAsfar J, Alahmer A, Saeed M. Life‑cycle assessment and techno‑economic analysis of a grid‑connected solar PV system. Energy Explor Exploit. 2026. Available from: https://dx.doi.org/10.1177/01445987261417705.
- Bishoge F, Zhang L, Mushi W. The potential renewable energy for sustainable development in Tanzania. Clean Technol. 2018;1(1):70‑88.
- Tanzania Electric Supply Company Ltd. Power system master plan, 2020 update. Dodoma: TANESCO/MEM; 2020.
- Luthander R, Widén J, Nilsson D, Palm J. Photovoltaic self‑consumption in buildings: a review. Appl Energy. 2015;142:80‑94.
- Lambert T, Gilman P, Lilienthal P. Micropower system modeling with HOMER. In: Integration of alternative sources of energy. Hoboken (NJ): Wiley; 2006. p. 379‑418.
- Ember. Yearly electricity data 2025: grid carbon intensity by country. London: Ember; 2025. Available from: https://ember‑energy.org
- Institute for Global Environmental Strategies. List of grid emission factors, ver. 11. Hayama (Japan): IGES; 2024. Available from: https://www.iges.or.jp/en/pub/list‑grid‑emission‑factor/en (iges.or.jp in Bing)
- Jordan DC, Kurtz SR. Photovoltaic degradation rates—an analytical review. Prog Photovolt Res Appl. 2013;21(1):12‑29.
- Zhu A. Techno‑economic and environmental analysis of PV–battery systems for rural electrification in Sub‑Saharan Africa. Energy Sustain Dev. 2022;71.
- United Republic of Tanzania. Nationally determined contribution (NDC) under the Paris Agreement. Dar es Salaam: Vice President’s Office; 2021.
- Weisser D. A guide to life‑cycle greenhouse gas emissions from electric supply technologies. Energy. 2007;32(9):1543‑59. Available from: https://doi.org/10.1016/j.energy.2007.01.008
- World Bank, Solargis. Global solar atlas 2.0 validation report. Washington (DC): ESMAP; 2019.
- Huld T, Müller R, Gambardella A. A new solar radiation database for estimating PV performance in Europe and Africa. Sol Energy. 2012;86(6):1803‑15. Available from: https://doi.org/10.1016/j.solener.2012.03.006
- NASA Langley Research Center. POWER: prediction of worldwide energy resources. Available from: https://power.larc.nasa.gov
- International Electrotechnical Commission. IEC 62053‑21 and IEC 62053‑22: electricity metering equipment (a.c.)—particular requirements: static meters for active energy. Geneva (Switzerland): IEC;
- International Organization for Standardization. ISO 14040:2006 and ISO 14044:2006: environmental management—life cycle assessment. Geneva (Switzerland): ISO; 2006.
- Hsu D, O’Donoughue P, Fthenakis V, Heath GA. Life cycle greenhouse gas emissions of crystalline silicon photovoltaic electricity generation: systematic review and harmonization. J Ind Ecol. 2012;16(S1):S122‑35. Available from: https://doi.org/10.1111/j.1530-9290.2011.00439.x
- Frischknecht R. Life cycle inventories and life cycle assessments of photovoltaic systems. IEA PVPS Task 12, Rep. T12‑19:2020; 2020.
- Joint Committee for Guides in Metrology. JCGM 100:2008: evaluation of measurement data—guide to the expression of uncertainty in measurement (GUM). Sèvres (France): BIPM; 2008.
- Nyholm E, Goop J, Odenberger M, Johnsson F. Solar photovoltaic‑battery systems in Swedish households—self‑consumption and self‑sufficiency. Appl Energy. 2016;183:148‑59. Available from: https://doi.org/10.1016/j.apenergy.2016.08.172
- Wassie YT, Ahlgren EO. Performance and reliability analysis of an off‑grid PV mini‑grid system in rural tropical Africa: a case study in southern Ethiopia. Develop Eng. 2023;8:100106. Available from: https://doi.org/10.1016/j.deveng.2022.100106
- Adu‑Poku A, Aidam GSK, Jackson GA, N’tsoukpoe KE, Kponyo JJ, Messan A, et al. Performance assessment and resilience of solar mini‑grids for sustainable energy access in Ghana. Energy. 2023;285:129431. Available from: https://doi.org/10.1016/j.energy.2023.129431
- Wassie YT, Ahlgren EO. Long‑term optimal capacity expansion planning for an operating off‑grid PV mini‑grid in rural Africa under different demand evolution scenarios. Energy Sustain Dev. 2023;76:101305. Available from: https://doi.org/10.1016/j.esd.2023.101305
- Gutsch M, Leker J. Global warming potential of lithium‑ion battery energy storage systems: a review. J Energy Storage. 2022;52:105030. Available from: https://doi.org/10.1016/j.est.2022.105030
- Pfeifroth U, Drücke J, Kothe S, Trentmann J, Schröder M, Hollmann R. SARAH‑3—satellite‑based climate data records of surface solar radiation. Earth Syst Sci Data. 2024;16:5243‑65. Available from: https://dx.doi.org/10.5194/essd-16-5243-2024
- Kakou PCK, Laouali D, Aka B, Osei JA, Ette NFK, Frey G. Multi‑timescale validation of satellite‑derived global horizontal irradiance in Côte d’Ivoire. Remote Sens. 2025;17(6):998.