
More Information
Submitted: October 26, 2026 | Accepted: October 30, 2026 | Published: November 02, 2026
Citation: Bakhshi M, Hassanshahi O, Azimi N, Andrade P. Dynamic Flexural Stiffness of Steel Fiber-Reinforced Concrete Beams under Impact Loading. Int J Phys Res Appl. 2026; 9(11):341-356. Available from:
https://dx.doi.org/10.29328/journal.ijpra.1001169
DOI: 10.29328/journal.ijpra.1001169
Copyright license: © 2026 Bakhshi M, et al. This is an open access article distributed under the Creative Commons Attribution License, which permits unrestricted use, distribution, and reproduction in any medium, provided the original work is properly cited.
Nomenclature: Steel fiber reinforced concrete; Drop-weight test; Flexural stiffness; Impact load; Strain rate; Inertia force

Dynamic Flexural Stiffness of Steel Fiber-Reinforced Concrete Beams under Impact Loading
Mohammad Bakhshi1*, Omid Hassanshahi2, Nima Azimi2 and Pedro Andrade3
1Department of Civil Engineering, Faculty of Engineering, University of Minho, Azurem 4800-058, Guimaraes, Portugal
2Faculty of Civil and Mechanical Engineering, Riga Technical University, Kipsalas 6A, LV-1048 Riga, Latvia
3Department of Structural Engineering, Luleå University of Technology, 971 87 Luleå, Sweden
*Address for Correspondence: Mohammad Bakhshi, Department of Civil Engineering, Faculty of Engineering, University of Minho, Azurem 4800-058, Guimaraes, Portugal, Email: [email protected]
This study examines the rate-sensitive flexural stiffness behavior of steel fiber-reinforced concrete (SFRC) beams subjected to quasi-static and impact loading. An experimental program was conducted on prismatic SFRC beams containing 1% hooked-end steel fibers (30 mm length, aspect ratio 80), tested over a wide strain-rate range from 10-6 to 20 s-¹. Flexural responses were captured using load cells, accelerometers, and digital image correlation to accurately measure midspan deflection and stiffness evolution. The results indicate that the initial flexural stiffness of SFRC increases with strain rate, highlighting the important contribution of inertial effects and enhanced fiber–matrix interaction under high strain rate loading. The rate sensitivity was most pronounced in the range of impact rather than range of quasi-static. At very high strain rates, several fibers exhibited reduced deformation capacity due to more brittle pull-out behavior and occasional rupture, leading to a slight reduction in the efficiency of fiber bridging and limiting further stiffness enhancement. Based on the experimental results, new empirical relationships are proposed to characterize the dynamic increase factor of flexural stiffness. These findings provide a deeper understanding of SFRC behavior under impact conditions and contribute to the development of more reliable design strategies for protective concrete structures.
Concrete structures such as bridges, protective barriers, and transportation infrastructures are frequently exposed to impact and other dynamic actions during their service life [1–5]. These loads may arise from accidental events, including vehicle collisions or dropped objects, as well as extreme scenarios such as blasts or intentional impacts [6–12]. Due to the inherently brittle nature of plain concrete, such loading conditions can lead to rapid stiffness degradation, severe cracking, and sudden failure, underscoring the need for materials with enhanced toughness, crack control, and energy dissipation capacity [13–15]. In this context, steel fiber-reinforced concrete (SFRC) has gained considerable attention. The inclusion of steel fibers significantly improves the post-cracking response, impact resistance, and overall structural performance by bridging cracks and redistributing stress under both static and dynamic loads [16–20].
While numerous studies have examined the strain-rate sensitivity of mechanical properties of concrete, such as compressive strength, tensile strength, and flexural capacity [13,21–23], there is still no comprehensive understanding of how strain rate influences the flexural stiffness of SFRC beams. Flexural stiffness is a fundamental parameter governing serviceability, crack propagation, deformation capacity, and the global dynamic response of structural members. Yet, its behavior under high strain rate loading remains insufficiently explored. Two primary challenges hinder progress in this area. First, accurate stiffness characterization under high strain rates requires advanced instrumentation, high-speed data acquisition, and precise measurement of deflection and curvature, conditions that complicate experimental testing [22,24,25]. Second, the flexural stiffness of SFRC is strongly affected by mix design, fiber geometry, distribution, orientation, and the size effect of the tested specimens [26–29]. Because of these interacting variables, developing a generalized model capable of predicting the rate-dependent stiffness of SFRC remains difficult [30].
In dynamic concrete research, strain-rate sensitivity is commonly expressed using the Dynamic Increase Factor (DIF), which relates dynamic to quasi-static mechanical properties [7]. While existing DIF models provide reliable predictions for the strength of plain concrete under tension or compression, such as the models by Malvar and Ross [31], Lok and Zhao [32], and the CEB-FIP Model Code [33,34], their applicability to SFRC is limited. The addition of fibers modifies fracture mechanisms, crack-bridging action, and the stiffness degradation path, particularly during the pre-cracking and early post-cracking stages [35]. As a result, experimental studies remain the most dependable approach for evaluating the rate-dependent flexural response of SFRC beams [36,37]. Figure 1 shows the loadings diagrams and schematic shape of the beam under impact load.
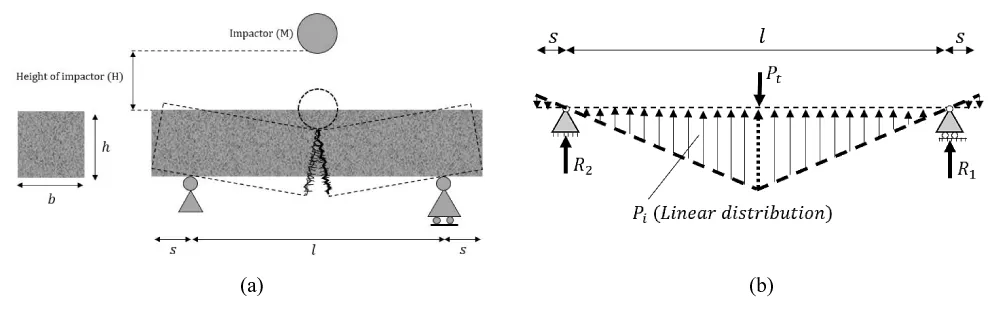
Figure 1: (a) Schematic of the impact loading setup and (b) Idealized beam under impact loading.
Previous investigations employing quasi-static bending tests, high-velocity drop-weight systems, and Split Hopkinson Pressure Bar (SHPB) techniques have demonstrated that SFRC exhibits enhanced peak load, fracture energy, and toughness as strain rate increases [38–40]. These studies primarily focused on strength-related parameters; however, several critical issues remain unresolved regarding the initial flexural stiffness, the rate-dependent contribution of fiber bridging before and after cracking, and the role of inertia and acceleration during impact loading. In particular, the mechanisms governing stiffness enhancement, such as matrix rate sensitivity, fiber–matrix interaction, and changes in fiber pull-out or rupture behavior, have not been systematically addressed in the literature. Consequently, despite advances in understanding peak resistance and fracture energy, the rate-sensitive flexural stiffness behavior of SFRC beams under dynamic loading remains poorly understood.
The present study addresses this gap by experimentally evaluating the flexural stiffness of SFRC beams over a wide range of strain rates, from quasi-static to impact loading conditions. Although previous studies have extensively investigated the strain-rate dependence of strength, fracture behavior, toughness, and impact resistance of SFRC, these parameters do not directly characterize the evolution of structural stiffness under dynamic loading. Flexural stiffness represents the relationship between load and deformation and is therefore a distinct parameter governing the deformation response of structural members. In this study, prismatic beams reinforced with hooked-end steel fibers were tested using conventional three-point bending and drop-weight impact setups. Particular attention is given to two stiffness measures representing different stages of the pre-peak response: the initial flexural stiffness, associated primarily with the initial uncracked response, and the average flexural stiffness, which characterizes the overall response up to the peak load and consequently incorporates the effects of progressive cracking and fiber engagement. The objectives are to quantify the evolution of these stiffness parameters with strain rate and to develop empirical relationships for their corresponding dynamic increase factors (DIFs). While existing DIF studies have predominantly focused on the enhancement of strength-related properties, the present study extends the DIF framework to flexural stiffness, thereby providing a complementary description of the rate-dependent load–deformation response of SFRC beams. The proposed relationships provide a means of incorporating strain-rate-dependent stiffness into the analysis of SFRC members and contribute to a more comprehensive assessment of their response under impact and other high-rate loading conditions (Figure 1).
Materials properties
The SFRC mix was designed following the volumetric proportioning method outlined in ACI 544.1R [41]. The mixture consisted of CEM I 42.5R cement conforming to EN 197-1 (2011), Class II fly ash in accordance with EN 450-1 (2012), natural fine and coarse aggregates with a maximum particle size of 12 mm, a high-range water-reducing admixture, hooked-end steel fibers, and water. The specific quantities of each constituent are listed in Table 1. Numerous experimental studies [1,7,8,13,36,42], and practical implementations of SFRC in structural components [43,44] indicate that a fiber volume fraction of 1% offers an effective compromise between mechanical performance enhancement (in flexure, shear, and compression) and material cost. Higher fiber contents typically require substantial adjustments to the mix design to prevent problems such as fiber agglomeration or balling and to ensure proper engagement of the fibers during loading [45]. Moreover, Banthia et al. [30] reported that a 1% volume fraction of hooked-end fibers significantly increases the impact energy absorption of concrete. Accordingly, the present study employed hooked-end steel fibers at a dosage of 1% by volume. The fibers had a density of 7.85 g/cm³, a length of 30 mm, and an aspect ratio of 80, as presented in Table 2. The water-to-cement ratio was maintained at 0.30 for all mixes.
| Table 1 : SFRC mixture proportions per m3 | ||||||
| Cement [kg] | Fly ash [kg] |
Water-cement content ratio | Fine aggregate (0-4 mm) [kg] |
Coarse aggregate (4-12 mm) [kg] |
Superplasticizer [kg] | Steel fiber [kg] |
| 400 | 200 | 0.3 | 942 | 628 | 4.8 | 78.5 |
| Table 2 : Steel fiber specifications and content. | ||||||
| Mass [kg/m3] | Volume [%] | Length [mm] |
Diameter [mm] |
L/D | Tensile strength [MPa] |
Modulus of elasticity [GPa] |
| 78.5 | 1 | 30 | 0.38 | 80 | 2300 | 210 |
The experimental program was specifically designed to investigate the influence of strain rate across quasi-static and impact loading regimes. Given the complexity of the rate-dependent response and the transition between these loading regimes, the fiber type and volume fraction, specimen geometry, and testing configuration were intentionally kept constant to minimize additional variability and enable a more direct assessment of the strain-rate effect. Accordingly, the present findings are specific to the investigated SFRC configuration containing 1% hooked-end steel fibers. Other fiber-related parameters, including volume fraction, aspect ratio, orientation, and fiber–matrix bond characteristics, may modify the rate-dependent flexural response. Further studies incorporating variations in these parameters are therefore required to establish the broader applicability of the observed trends and proposed relationships.
Specimen preparation
To evaluate the static mechanical properties of each SFRC mix, compressive strength and modulus of elasticity tests were performed following the procedures specified in EN 12390-4 [46] and EN 12390-13 [47], respectively. For these measurements, three cylindrical specimens measuring 100 mm in diameter and 200 mm in height were cast for each mixture. Additionally, the flexural performance under static loading was assessed through three-point bending tests conducted on three notched prisms with dimensions of 100 × 100 × 400 mm³. The results from these tests, including compressive strength and residual flexural tensile strengths at different Crack Mouth Opening Displacement (CMOD) levels, are presented in Table 3.
| Table 3: Residual flexural tensile strengths at selected CMOD levels | ||||||
| Compressive strength [MPa] | Flexural tensile strength [MPa] | Residual flexural tensile strength [MPa] at CMOD [mm] | ||||
| 0.5 | 1.5 | 2.5 | 3.5 | 4.5 | ||
| 72.29 (5.50) | 5.75 (0.50) | 3.80 | 4.33 | 4.29 | 3.6 | 3.22 |
| Note: Coefficients of variation are reported in parentheses (%). | ||||||
In the quasi-static range, corresponding to strain rates from 10⁻⁶ to 10⁻² s-1, four different displacement rates were employed, Table 4. For the impact loading regime, four separate drop heights were used to induce a range of loading rates. Under each testing condition, three notched prisms with dimensions of 100 × 100 × 400 mm³ were cast (e.g., HS1500-1, HS1500-2, and HS1500-3 represent the three specimens tested at a drop height of 1500 mm). The notches were prepared in accordance with EN 14651 [48], with a depth equal to roughly one-sixth of the specimen depth and a constant notch width of 3 mm [37].
| Table 4: Experimental program: sample preparation and testing | |||
| Range of Quasi-static | Range of Impact | ||
| Specimen ID | Displacement rate [mm/min] | Specimen ID | Height of impactor [mm] |
| S | 0.3 | HS250 | 250 |
| Q18 | 18 | HS500 | 500 |
| Q120 | 120 | HS1000 | 1000 |
| Q500 | 500 | HS1500 | 1500 |
Quasi-static tests
The quasi-static three-point bending tests were performed using a servo-hydraulic testing machine [49]. To obtain deflection measurements unaffected by seating or support movements, a steel plate fitted with a linear variable differential transformer (LVDT) was installed at the specimen’s mid-height and anchored to the supports, enabling accurate determination of the average midspan displacement. A second LVDT was positioned at the notch to record the CMOD at mid-depth. Because precise strain-rate values needed to be derived directly from the experiments, a strain gauge was attached to the compression zone at the midspan of the beam, as shown in Figure 2.
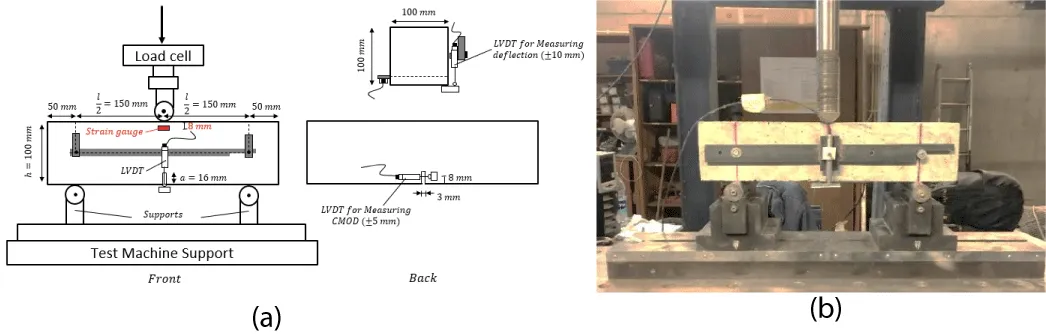
Figure 2: Three-point notched beam bending test setup: (a) Schematic view; (b) Experimental setup.
Instrumented drop weight impact test
An instrumented drop-weight system was used to apply flexural impact loading, as illustrated in Figure 3. The setup is capable of releasing a hammer with a mass of up to 290 kg from heights of up to 9 m, corresponding to a maximum theoretical impact velocity of 13.3 m/s. To facilitate inertia-related force measurements, two load cells were incorporated into the system: a 1000 kN load cell mounted on the impactor to measure the applied impact force, and a 500 kN load cell placed beneath the specimen to capture the reaction force at the support. Both sensors were connected to a computerized data acquisition system consisting of a SCXI 1000DC chassis equipped with three input modules (National Instruments, Austin, Texas). Data were collected at a sampling rate of 50 points per millisecond () across multiple channels, which was verified to be adequate for accurately capturing the transient response during impact.
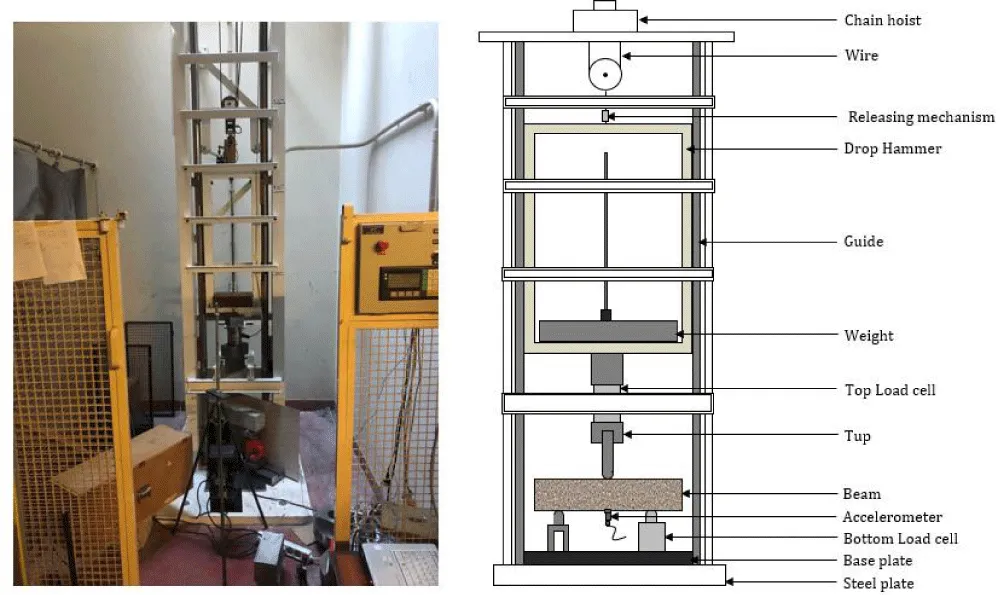
Figure 3: Drop-weight impact setup for flexural beam testing.
A strain gauge was installed in the compression zone, positioned 8 mm below the top surface of the beam, to measure compressive strain during impact loading. To estimate the strain at the extreme compression fiber, the recorded strain values were multiplied by a scaling factor of 50/(50 − 8), assuming a linear strain profile along the section depth [50]. The corrected strain values were then used to compute the corresponding strain rates.
Two accelerometers, each with a capacity of 5000 g (49,050 m/s²) and an upper frequency limit of 12,000 Hz, were mounted at the beam’s midspan to record acceleration during impact loading. Simultaneously, the midspan acceleration history was also obtained using a digital image correlation (DIC) method. The 2D DIC setup consisted of a single high-speed camera (PHOTRON FastCam APX-RS, Japan) operating at a resolution of 128×256 pixels and a frame rate of 15,000 frames per second, as illustrated in Figure 4. This frame rate corresponds to a temporal resolution of approximately 66.7 μs between consecutive images, providing sufficient temporal resolution to track the global deformation response throughout the investigated impact events, including those associated with strain rates approaching 20 s-1. Adequate illumination for image capture was provided by four halogen lamps positioned around the testing arrangement. The captured image sequences were subsequently transferred to a host computer for post-processing and analysis.
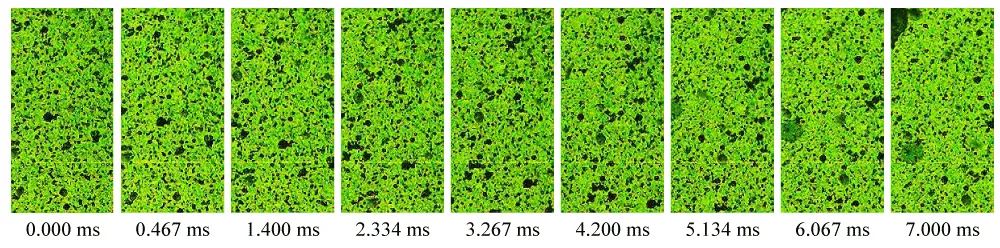
Figure 4: Typical high-speed imaging sequence during SFRC impact test (H50M100l30E41-1) [0 to 7 millisecond].
In the DIC process, randomly distributed speckle patterns within a designated area of interest (AOI) are tracked between the reference and subsequently deformed images. Following image calibration, the displacement of individual speckle points relative to their initial positions can be evaluated, enabling the deformation field to be accurately quantified [51]. In the present study, DIC was primarily employed to determine the midspan displacement and its time history rather than to quantify highly localized strain fields. The adequacy of the adopted temporal and spatial resolutions was further assessed by comparing the DIC-based midspan response with that independently obtained from the accelerometers. The close agreement between the two measurement approaches, as presented in Figure 7, supports the suitability of the adopted DIC configuration for capturing the global dynamic response of the specimens.
The DIC technique was utilized to obtain full-field strain and displacement measurements for the prism specimens subjected to three-point bending under impact loading. In addition, the method allowed tracking crack initiation and propagation, as well as assessing the global failure pattern and resulting fracture surfaces, as shown in Figure 5. The high-speed image sequences were processed using the GOM Correlate software, which was also employed to extract the corresponding strain and displacement fields from the recorded images.
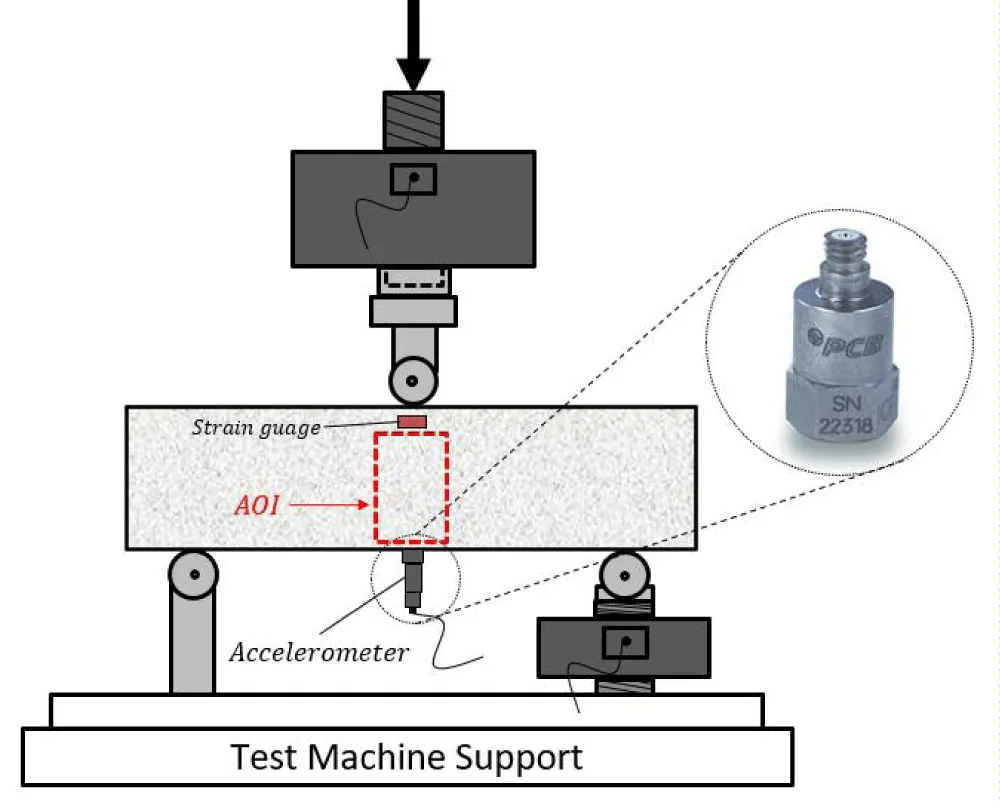
Figure 5: Acceleration measurement techniques using accelerometers and digital image correlation (DIC).
The change in hammer velocity during the impact event was computed by combining the initial contact velocity with the time-integrated acceleration measured by the accelerometers. The displacement at the impact point was then derived by integrating the resulting hammer velocity over time.
(1)
(2)
This equation expresses the relationship between the midspan acceleration, , velocity, , and deflection, recorded during testing. In accordance with the recommendations of RILEM TC 162-TDF and EN 14651, the flexural strength of a notched prism under three-point loading is determined using the peak reaction force, . In Eq. (3), the parameters h, a, and l represent the specimen height, notch depth, and span length, respectively.
(3)
Failure pattern and fracture surfaces
Figure 6a shows the failure patterns observed in beams tested at low loading rates within the quasi-static regime. Under these conditions, a primary crack formed at midspan, accompanied by a limited number of secondary cracks branching from the main fracture. Comparison across different loading regimes indicates that quasi-static tests generated fewer secondary cracks, whereas impact loading resulted in more extensive crack branching. The fracture behavior of SFRC beams under varying loading rates is largely governed by the interaction between the concrete matrix and the fiber–matrix interface. In quasi-static tests, fiber pull-out was the predominant mechanism; however, impact loading produced a mixture of fiber pull-out and tensile fiber rupture, as shown in Figure 6b. The occurrence of fiber rupture increased with drop height, although pull-out remained the dominant mode of fiber failure. Following testing, the fracture surfaces were visually examined, and the numbers of pulled-out and ruptured fibers crossing the fracture surface were counted. The percentage of ruptured fibers was calculated as the ratio of ruptured fibers to the total number of fibers identified on the fracture surface. The proportion of ruptured fibers rose consistently with increasing drop height, reaching 2.3%, 4.1%, 6.9%, and 11.5% for drop heights of 250, 500, 1000, and 1500 mm, respectively. These observations provide direct evidence of an increasing tendency toward fiber rupture with increasing impact intensity; however, no quantitative assessment of pull-out length or microscopic characterization was conducted.
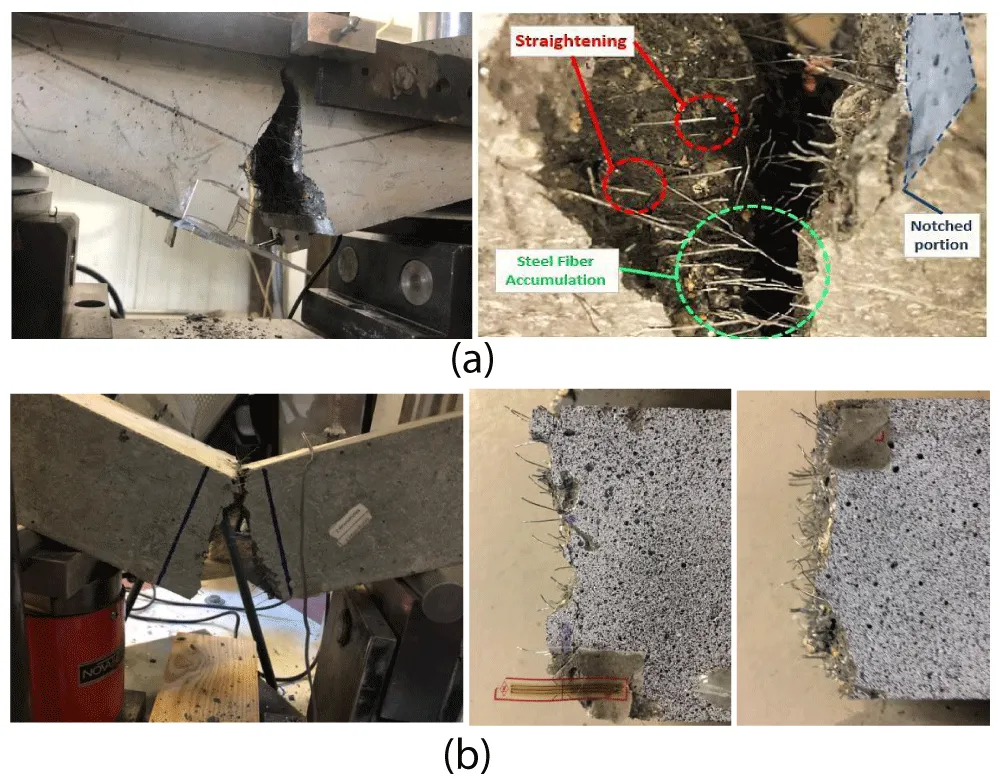
Figure 6: Fracture patterns of SFRC beams subjected to (a) Quasi-static and (b) Impact loading.
Reaction force-deflection diagrams
Figure 7 presents a comparison of the midspan deflection obtained using two independent methods: (i) double integration of the acceleration records from the accelerometers, as described in Eq. (2), and (ii) direct displacement measurement via the digital image correlation (DIC) technique. For all specimens, the deflections measured using DIC were slightly greater than those calculated from the integrated acceleration data. This discrepancy arises because DIC computes displacement directly from the motion of surface points within the selected area of interest, whereas acceleration-based deflection requires numerical integration and depends on the time history of the signal. Additionally, the accelerometers were mounted at the midspan along the bottom surface, and their recorded accelerations were assumed to represent the average response across the section depth. In this study, deflections derived from the DIC method were primarily used for subsequent analysis due to their higher spatial resolution and direct measurement capability. Nevertheless, the deflections obtained from integrated acceleration data exhibited strong agreement with the DIC results, confirming the reliability of both approaches. Furthermore, the maximum strain rate in the tested beams was determined from the strain histories directly recorded by the strain gauge. The reported strain rate represents the local longitudinal compressive strain rate at the extreme compression fiber of the midspan section. The strain was measured using a strain gauge positioned at midspan, 8 mm below the top surface of the specimen, and was corrected to the extreme compression fiber assuming a linear strain distribution over the section depth. The strain rate was then determined directly from the time derivative of the corrected strain-time history rather than prescribed as an input parameter. Therefore, the reported values represent local compressive strain rates at midspan rather than average sectional strain rates. Consequently, some variation among specimens subjected to the same nominal impact condition is expected due to specimen-to-specimen differences in the local dynamic response and crack development.
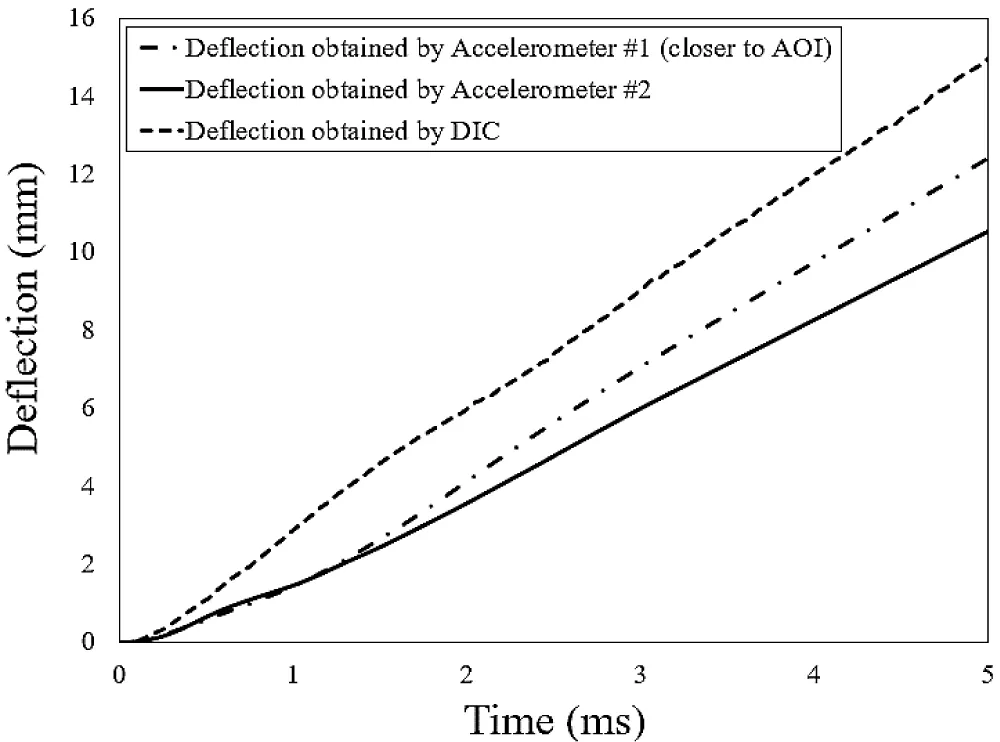
Figure 7: Deflection–time histories obtained from DIC and accelerometer measurements (HS1500-2).
The test conducted at the lowest strain rate was considered the static reference condition, whereas the tests performed at higher rates within the low-rate regime were classified as quasi-static. This distinction is adopted here to facilitate comparison of the flexural response with increasing strain rate. In the impact tests, the reaction force was obtained by doubling the value recorded by the bottom load cell, owing to the symmetry of the testing configuration [7,9]. The first peak in the impact force–time history represents the dynamic tensile strength of the specimen, and its magnitude increased with the hammer drop height. At greater drop heights, the post-peak segment of the load–deflection response displayed multiple secondary peaks, as shown in Figure 8. After the primary peak deflection, the behavior of the SFRC specimens was governed by fiber bridging, as fibers crossing the developed cracks continued to transfer tensile stresses and sustain the post-peak load-carrying capacity. This interpretation was further supported by examination of the fracture surfaces, where pullout was identified as the predominant fiber failure mode, demonstrating continued engagement across the cracks after matrix cracking. With progressive post-peak deflection, the load-carrying contribution of the fibers gradually decreased, aligning with the findings reported by Park, et al. [52].
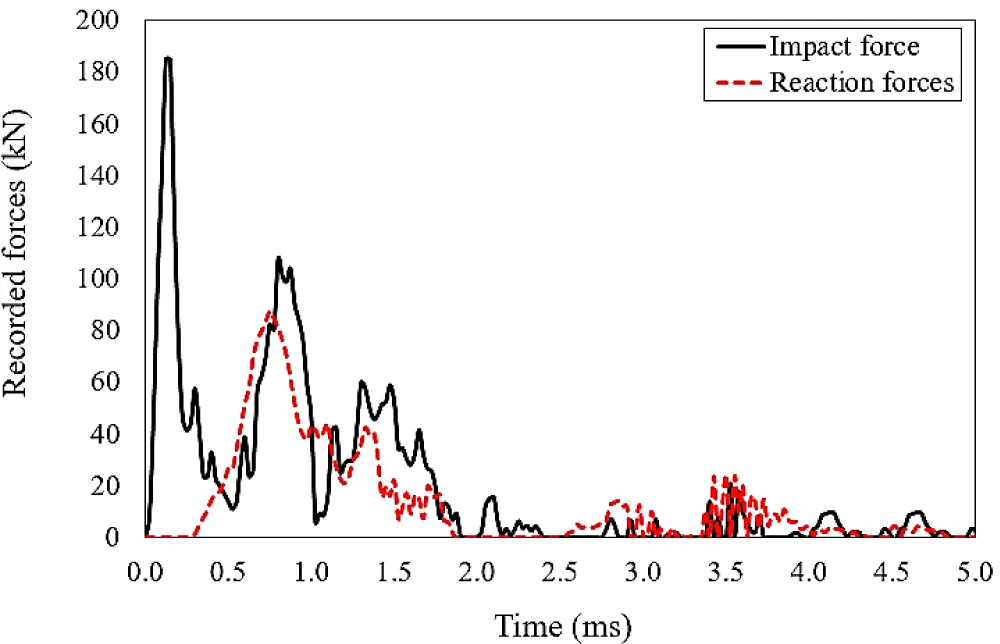
Figure 8: Typical time histories of impact and reaction forces for an HS1500-2 specimen.
A consistent time lag was observed between the impact-force and reaction-force signals, corresponding to the travel time of the shear wave from the midspan impact location to the supports. This delay decreased as the impact velocity (and thus the drop height) increased, with measured values of approximately 620, 551, 275, and 170 µs for drop heights of 250, 500, 1000, and 1500 mm, respectively. Representative relationships between reaction force and midspan deflection for both quasi-static and impact loading regimes are presented in Figures 9 and 10.
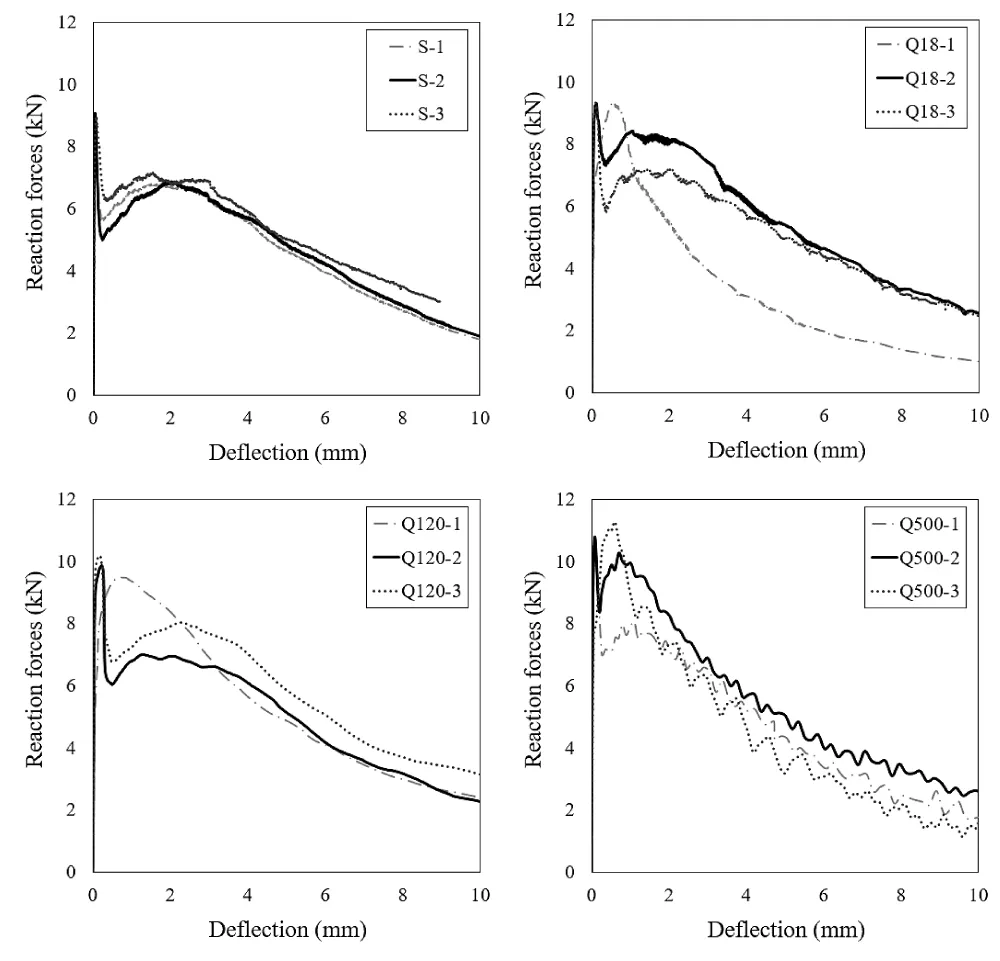
Figure 9: Reaction force versus midspan deflection curves for static and quasi-static tests.
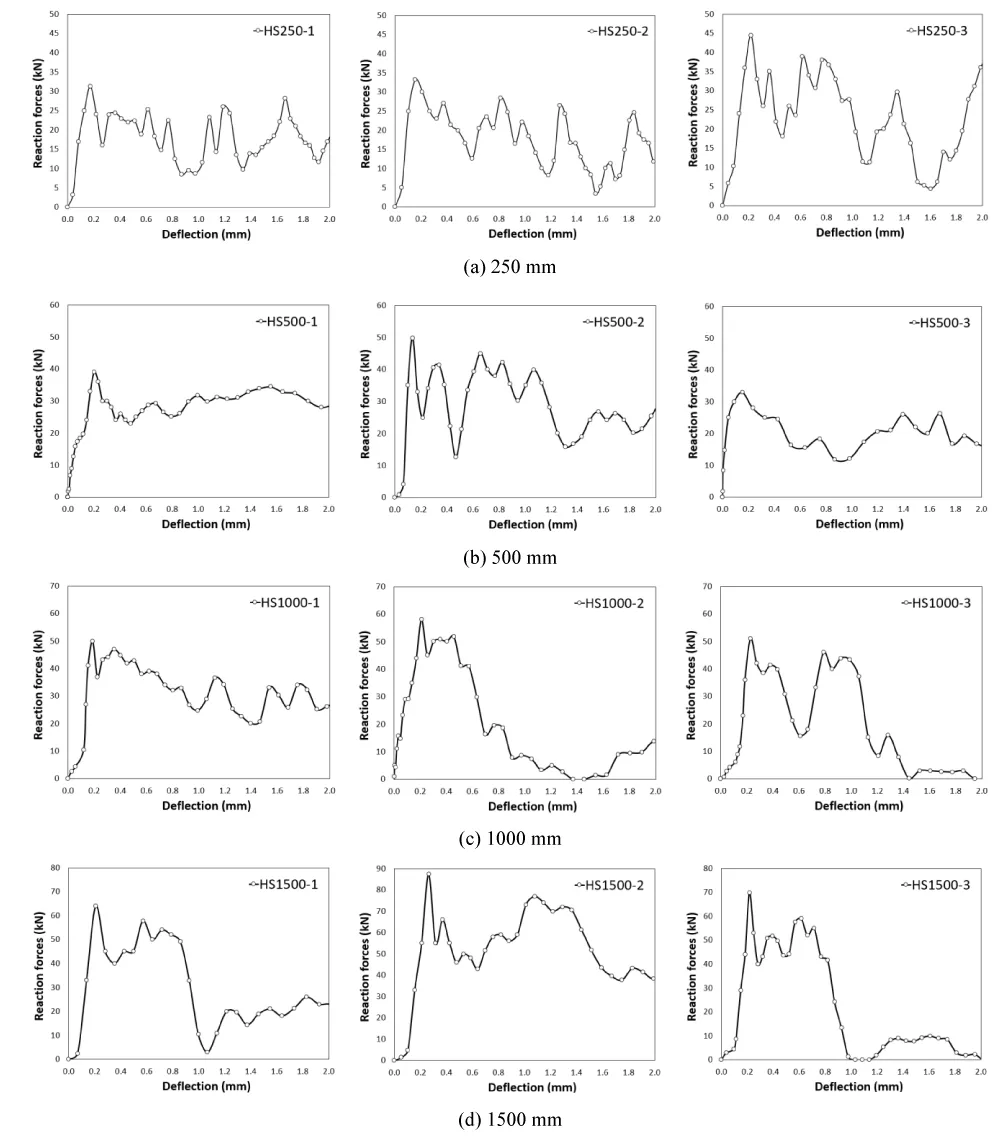
Figure 10: Reaction force versus midspan deflection curves for various impact heights.
Effect of inertia force under impact loading
As shown in Figure 11, the impact load (Pt) may be idealized as a concentrated force applied at midspan, while the inertia force is distributed along the beam’s length and acts in the direction opposite to the deflection. Two equal reaction forces develop at the supports due to symmetry. By representing the distributed inertia force with an equivalent point load and applying the dynamic equilibrium condition, the reaction force can be written as the difference between the impact force and the inertia force, as given in Eq. (4). For a virtual deflection (δv) that satisfies the boundary conditions, the corresponding virtual-work expression used to evaluate the inertia force is presented in Eq. (5) [53]:
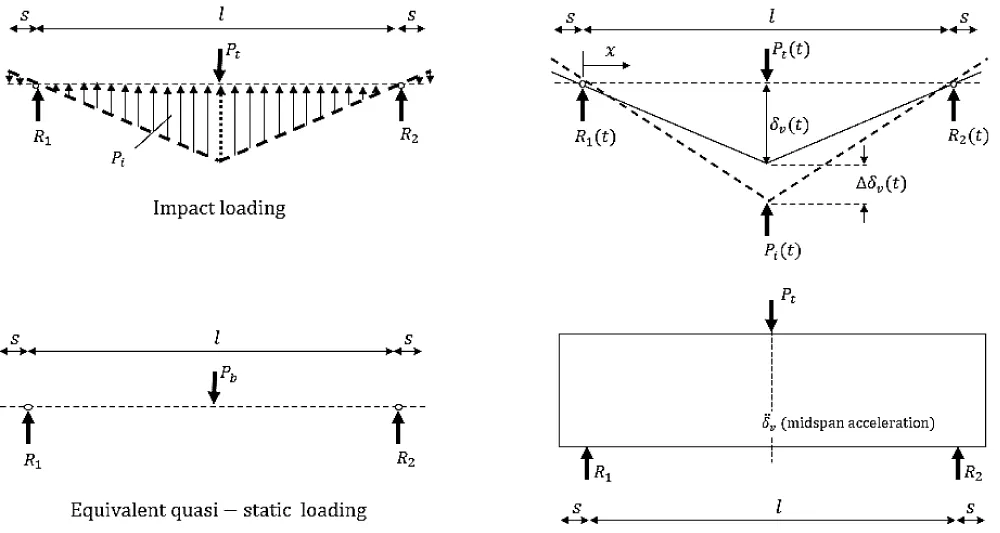
Figure 11: Schematic representation of inertia force in the flexural impact test.
(4)
(5)
In this formulation, denotes the local acceleration along the beam, is the virtual deflection, ρ is the material density, A is the cross-sectional area, l is the span length, and s represents the overhanging length of the specimen. To facilitate the computation of the inertia force, the acceleration profile along the span may be approximated using either a linear or a sinusoidal distribution. In the present study, a linear distribution was adopted, resulting in the simplified form presented in Eq. (6) [53]. After determining the inertia force (Pi), the corresponding bending force (Pb) can be evaluated, enabling the dynamic system to be represented as an equivalent static beam, as depicted in Figure 11. Under the assumption of a linear variation of acceleration and inertia forces along the beam, the reaction force at each support is obtained using Eq. (7).
(6)
(7)
The findings of the present study corroborate the observations reported by Bentur and Mindess [54], who noted that both acceleration and displacement vary approximately linearly along the beam span. Accordingly, the reaction force was estimated as twice the load measured at one support, consistent with the symmetric test configuration [6], as summarized in Table 5. Figure 12a compares the inertia forces obtained experimentally with those calculated analytically. Statistical evaluation of the two datasets yielded a coefficient of determination (R²) of 0.83 and a mean absolute percentage error (MAPE) of 26%, indicating that the analytical model provides a satisfactory prediction of the inertia force. The observed deviation can mainly be attributed to the simplified linear representation of the acceleration distribution adopted in the analytical calculation, whereas the actual dynamic response of the specimens is spatially and temporally nonuniform. Local variations in acceleration and crack development may further contribute to this discrepancy. It should be emphasized that the experimentally obtained inertia forces, rather than the analytical estimates, were used for the subsequent analyses in this study. Therefore, the observed analytical deviation does not affect the experimental results and conclusions presented herein. The average ratio of inertia to impact load was approximately 0.6 and appeared largely insensitive to strain rate, as shown in Figure 12b. This behavior is consistent with the results reported in [7,9]. The inertia force was experimentally determined from the dynamic equilibrium of the specimen as the difference between the measured impact force and the total support reaction. Owing to the symmetric test configuration, the total reaction force was calculated as twice the force measured at one support. To assess the reliability of this approach, the experimentally obtained inertia forces were compared with those estimated analytically using the measured midspan acceleration and the assumed acceleration distribution along the beam. The comparison yielded an (R2) of 0.83, indicating that the analytical estimation captured the overall trend of the experimentally determined inertia force. The observed deviation between the two approaches is mainly associated with the simplified representation of the acceleration distribution in the analytical calculation, as discussed above. The relative stability of this ratio may be attributed to the fact that the inertia force is primarily governed by the specimen mass and its acceleration distribution, while the impact force is simultaneously influenced by the dynamic interaction between the impactor and specimen. Therefore, the inertia-to-impact load ratio does not necessarily exhibit the same strain-rate sensitivity as the mechanical properties of SFRC. However, the ratio may vary with parameters affecting the dynamic equilibrium of the system, particularly specimen geometry, span length, mass distribution, and impact conditions. Accordingly, the value of approximately 0.6 should be regarded as specific to the range of specimens and loading conditions investigated herein and cannot be assumed to remain constant at strain rates beyond the examined range without further experimental validation.
| Table 5: Summary of measured and calculated impact, reaction, and inertia forces. | |||||||
| Sample | Strain rate [s-1] | Impact force, Pt [kN] | Reaction forces, Pb [kN] | Inertia force, Pi [kN] | Pi / Pt | ||
| Pt - Pb (Directly) | Eq. (7) (Indirectly) | Directly | Indirectly | ||||
| HS250-1 | 2.23 | 67.69 | 31.25 | 36.44 | 57.08 | 0.54 | 0.84 |
| HS250-2 | 4.49 | 63.69 | 33.24 | 30.44 | 36.85 | 0.48 | 0.58 |
| HS250-3 | 5.87 | 76.56 | 44.52 | 32.04 | 45.08 | 0.42 | 0.59 |
| HS500-1 | 4.43 | 106.14 | 41.53 | 64.62 | 75.45 | 0.61 | 0.71 |
| HS500-2 | 11.09 | 114.85 | 41.76 | 73.10 | 66.12 | 0.64 | 0.58 |
| HS500-3 | 6.64 | 89.21 | 49.84 | 39.37 | 60.95 | 0.44 | 0.68 |
| HS1000-1 | 9.08 | 148.22 | 58.04 | 90.18 | 57.25 | 0.61 | 0.39 |
| HS1000-2 | 10.12 | 147.32 | 51.01 | 96.31 | 84.29 | 0.65 | 0.57 |
| HS1000-3 | 8.74 | 138.08 | 48.47 | 89.62 | 102.19 | 0.65 | 0.52 |
| HS1500-1 | 9.71 | 173.81 | 63.96 | 109.85 | 147.26 | 0.63 | 0.85 |
| HS1500-2 | 13.49 | 185.16 | 87.45 | 97.72 | 98.21 | 0.53 | 0.45 |
| HS1500-3 | 13.37 | 183.58 | 69.81 | 113.77 | 116.48 | 0.62 | 0.51 |
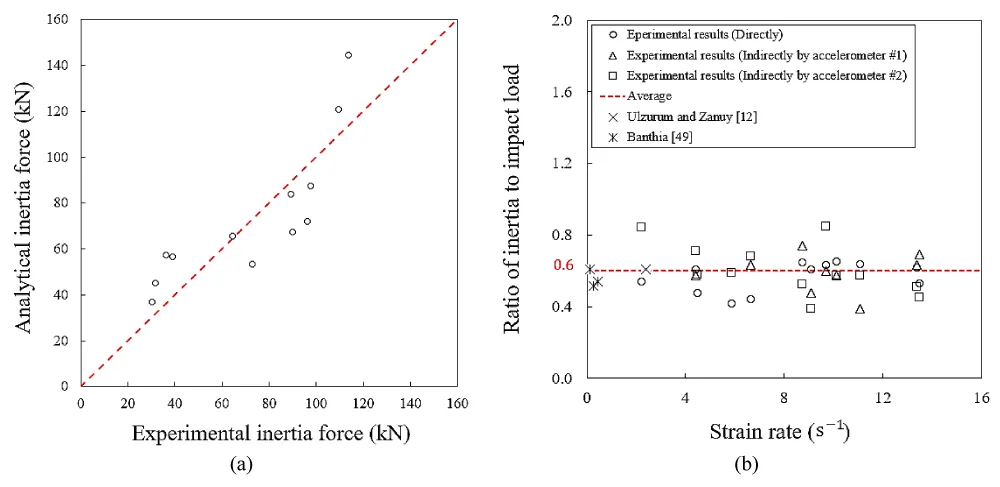
Figure 12: (a) Experimental vs analytical inertia force results; (b) Variation of inertia-to-impact force ratio with strain rate.
The present study is primarily experimental and focuses on the characterization of strain-rate-dependent flexural stiffness under quasi-static and impact loading. The stiffness evaluation and proposed DIF relationships are therefore based directly on the experimentally measured response. Although the experimental results provide insight into the observed rate-dependent behavior, the individual contributions of matrix cracking, fiber bridging, and dynamic effects cannot be fully separated from the global response. A refined nonlinear finite element model incorporating rate-dependent constitutive behavior, concrete cracking and crushing, fiber bridging, impact contact, and inertia effects would provide a valuable extension of the present work and enable these mechanisms to be investigated independently.
Under impact loading, the flexural stiffness parameters were calculated using the measured support reaction force and corresponding midspan deflection rather than the applied impact force. Accordingly, the reported values represent the dynamic flexural response of the beam–support system and should not be interpreted as intrinsic material stiffness. Although the use of support reactions avoids directly incorporating the total impact force into the stiffness calculation, the measured response may still be influenced by inertia, stress-wave propagation, and transient deformation effects.
Owing to the symmetric specimen geometry, central impact location, and nominally identical support conditions, the total support reaction was estimated as twice the reaction measured at one support. This assumption is consistent with the nominal symmetry of the experimental configuration. Nevertheless, local differences in contact conditions, crack development, and transient wave propagation may produce unequal instantaneous reactions, particularly during the early impact response. Therefore, the assumed symmetry represents an approximation, and the associated uncertainty should be considered when interpreting the experimentally determined inertia forces and dynamic stiffness.
Effect of strain rate on flexural stiffness of SFRC beams
Under impact loading, the impact force is not directly equivalent to the force contributing to the flexural response because part of the applied force is associated with specimen inertia. Accordingly, the impact force was separated into the inertia and reaction-force components based on dynamic equilibrium. The flexural stiffness parameters in the present study were calculated using the measured reaction force rather than the total impact force. Therefore, the reported initial and average stiffness values represent the force transmitted through the specimen to the supports relative to the corresponding midspan deflection, thereby reducing the direct influence of inertia associated with the use of the raw impact force. Nevertheless, the measured deformation remains part of the transient dynamic response; hence, the reported values should be interpreted as dynamic flexural stiffness measures rather than purely static material stiffness. In the current study, the flexural stiffness of the SFRC beams was evaluated using both the initial kinetic stiffness (kinitial) and the average kinetic stiffness (kavg), enabling a comprehensive assessment of how strain rate influences stiffness throughout the loading process, Figure 13. The initial flexural stiffness was obtained from the slope of the linear elastic portion of the load–deflection curve, prior to crack initiation. For each test, a linear regression was applied to the early segment of the response, typically within the first 5–20% of the peak load, where the relationship between load and deflection remained strictly linear. This stiffness represents the elastic behavior of the uncracked section and is primarily governed by the modulus of elasticity of the concrete matrix and the geometric characteristics of the beam. It can be expressed as:
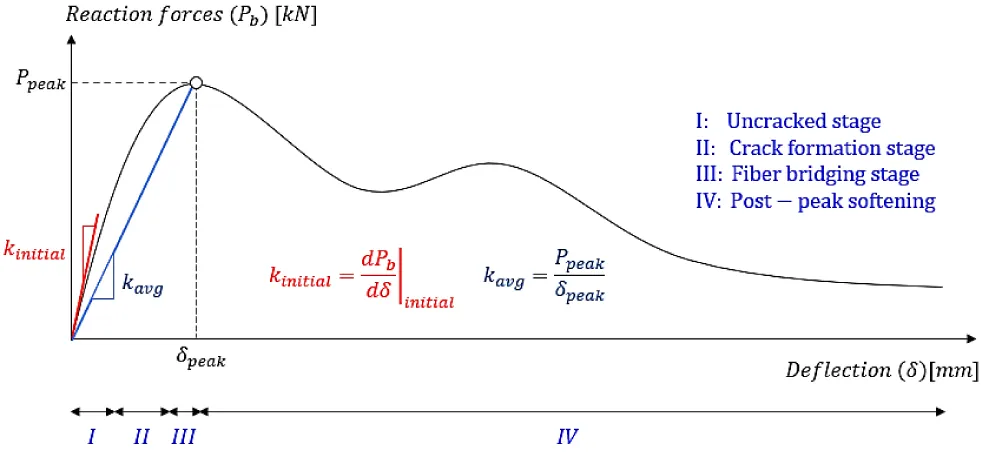
Figure 13: Definition of initial and average kinetic flexural stiffness on a typical load–deflection response.
(8)
where Pb is the applied load and δ is the midspan deflection. To characterize the stiffness over the entire pre-peak response, an average kinetic stiffness was also calculated as:
(9)
where Ppeak is the maximum reaction force and δpeak is the corresponding midspan deflection. Unlike initial stiffness, this parameter reflects the overall flexural resistance up to peak load and incorporates the combined influence of elastic behavior, microcracking, and fiber bridging. The initial flexural stiffness was determined from a linear regression of the initial approximately linear portion of the reaction force–midspan deflection curve. A consistent fitting criterion was applied to all specimens to minimize subjective selection of the fitting interval and ensure comparability across the investigated strain rates.
The results of the three-point bending tests performed in the quasi-static and impact regimes are presented in Table 6.
| Table 6: Experimental results of three-point bending tests | ||||||
| Sample | Strain rate [s-1] | ffta [MPa] | kinitialb [kN/mm] | DIFk, initial | Kavgc [kN/mm] | DIFk, avg |
| S (Average) | 3.41×10⁻⁶ | 5.75 (0.50) | 179.57 (1.22) | 1.000 | 178.42 (1.67) | 1.000 |
| Q18-1 | 1.00×10⁻⁴ | 5.94 | 179.32 | 0.999 | 183.91 | 1.031 |
| Q18-2 | 1.00×10⁻⁴ | 5.94 | 179.97 | 1.002 | 179.60 | 1.007 |
| Q18-3 | 1.00×10⁻⁴ | 5.96 | 179.32 | 0.999 | 173.79 | 0.974 |
| Q120-1 | 5.52×10⁻³ | 6.05 | 180.62 | 1.006 | 185.34 | 1.039 |
| Q120-2 | 5.52×10⁻³ | 6.30 | 180.71 | 1.006 | 180.20 | 1.010 |
| Q120-3 | 5.52×10⁻³ | 6.49 | 180.34 | 1.004 | 178.41 | 1.000 |
| Q500-1 | 5.56×10⁻² | 6.69 | 180.43 | 1.005 | 181.67 | 1.018 |
| Q500-2 | 5.56×10⁻² | 6.87 | 181.14 | 1.009 | 194.71 | 1.091 |
| Q500-3 | 5.56×10⁻² | 7.19 | 180.85 | 1.007 | 184.65 | 1.035 |
| HS250-1 | 2.23 | 14.06 | 179.82 | 1.001 | 179.42 | 1.006 |
| HS250-2 | 4.49 | 14.96 | 182.62 | 1.017 | 190.55 | 1.068 |
| HS250-3 | 5.87 | 20.04 | 186.80 | 1.040 | 207.14 | 1.161 |
| HS500-1 | 4.43 | 23.07 | 188.28 | 1.049 | 213.03 | 1.194 |
| HS500-2 | 11.09 | 18.79 | 189.49 | 1.055 | 217.85 | 1.221 |
| HS500-3 | 6.64 | 22.43 | 191.65 | 1.067 | 226.41 | 1.269 |
| HS1000-1 | 9.08 | 26.12 | 198.79 | 1.107 | 254.78 | 1.428 |
| HS1000-2 | 10.12 | 22.96 | 201.75 | 1.124 | 266.56 | 1.494 |
| HS1000-3 | 8.74 | 21.81 | 205.39 | 1.144 | 281.00 | 1.575 |
| HS1500-1 | 13.49 | 39.35 | 214.14 | 1.193 | 315.80 | 1.770 |
| HS1500-2 | 13.37 | 31.42 | 217.91 | 1.214 | 330.79 | 1.854 |
| HS1500-3 | 9.71 | 28.78 | 211.85 | 1.180 | 306.70 | 1.719 |
For comparison, the mean static stiffness was adopted as reference values. The corresponding dynamic increase factors, and , were derived for each strain-rate level. The results show that with increasing strain rate, the initial flexural stiffness exhibited a noticeable increase. This trend is attributed to the rate sensitivity of the concrete matrix, which displays a higher apparent modulus of elasticity under high strain rate loading, as well as the influence of inertia during the initial impact phase. Since fibers remain largely inactive before cracking, their contribution to the initial stiffness is minimal; therefore, the observed increase is mainly associated with material-rate effects, and the dynamic amplification present during high-rate loading. As the impact velocity increased, the slope of the linear-elastic region became progressively steeper, demonstrating that the stiffness enhancement occurs predominantly in the pre-cracking stage. As the strain rate increased, the average stiffness also increased, but the magnitude of this increase was greater than that observed for the initial stiffness. This difference indicates that fiber-bridging mechanisms benefit more from rapid loading, as higher strain rates promote stronger fiber–matrix bond and delay crack opening, resulting in an increased load capacity at smaller deflections.
A comparison between the two stiffness measures revealed that strain rate influences the structural response through different mechanisms in the pre-cracking and pre-peak regions. The initial stiffness increase is largely attributed to the elastic rate sensitivity of the concrete matrix, whereas the average stiffness increase is more closely associated with enhanced fiber engagement and delayed crack propagation. As a result, the overall stiffness enhancement becomes increasingly pronounced with strain rate, confirming the dynamic stiffening behavior of SFRC beams under impact loading. Overall, the results demonstrate that both stiffness measures exhibit clear strain-rate dependency, but their sensitivities differ due to underlying cracking and fiber-bridging mechanisms. The combined use of initial and average kinetic stiffness provides a more complete understanding of the dynamic flexural behavior of SFRC beams and highlights the importance of considering multiple stiffness indicators when assessing impact performance and rate-dependent structural response.
The variability of the experimentally determined stiffness parameters was evaluated using the standard deviation and coefficient of variation of the three specimens tested under each loading condition. These measures provide an indication of experimental repeatability, although the limited number of specimens restricts the statistical precision of the variability estimates. To better represent the current experimental data, two empirical expressions were formulated for the quasi-static and impact ranges, respectively. These equations, given by Eqs. (10) and (11), use 1 s-1 as the transition strain rate ( ) and incorporate parameters fitted to the measured and values. The transition strain rate, ( ), was adopted as a practical boundary between the quasi-static and impact regimes rather than statistically identified as a unique critical threshold from the present dataset. This value provides a convenient separation between the two loading regimes investigated herein, for which a markedly stronger rate dependence of flexural stiffness was observed under impact loading. Accordingly, the value of 1 s-1 should not be interpreted as a universal transition threshold for SFRC. Its precise value may vary with material characteristics, specimen geometry, and loading conditions, and additional experimental data around the transition region would be required for its statistical determination. The corresponding coefficients are listed in Table 7.
(10)
(11)
In Eqs. (10) and (11), , , and represent the measured compressive strain rate, reference strain rate, and adopted transition strain rate, respectively. The ratio is dimensionless, and the empirical coefficients A, B, and C are therefore dimensionless.
The uncertainty associated with the fitted coefficients was evaluated using nonparametric bootstrap resampling. The 95% confidence intervals were determined from the 2.5th and 97.5th percentiles of the bootstrap coefficient distributions. These intervals provide an indication of coefficient stability within the investigated experimental dataset. Figure 14 presents a comparison between experimental and predicted DIFk,initial and DIFk,avg values. Since no existing analytical or empirical models are available in the literature for evaluating the dynamic flexural stiffness of SFRC beams, the present study provides a set of predictive relationships for both DIFk,initial and DIFk,avg. The accuracy of each model was evaluated using statistical indicators such as the R-squared value (R²), mean absolute deviation (MAD), and mean absolute percentage error (MAPE), Eqs. (12) and (13),
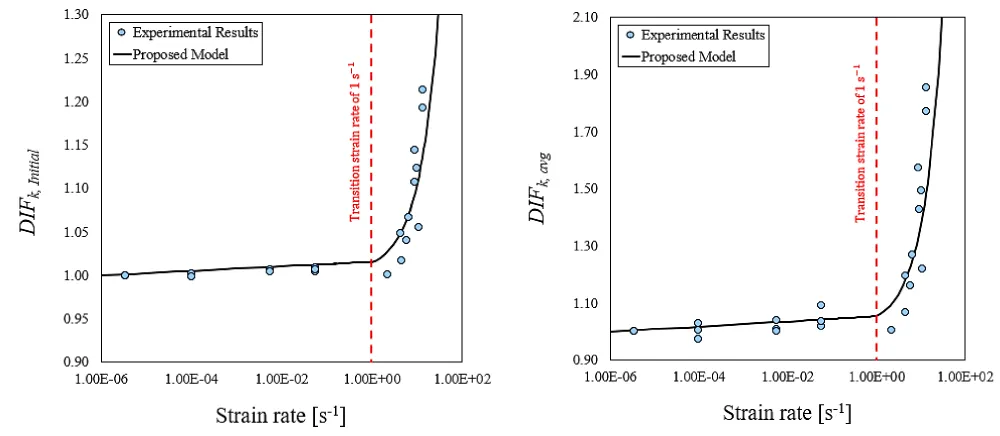
Figure 14: Empirical DIF estimations of SFRC’s DIFk,initial and DIFk,avg.
(12)
(13)
where pre is the model prediction, exp is the experimental result, and N is the total number of specimens. To assess the internal robustness of the proposed empirical relationships, a nonparametric bootstrap analysis with 5,000 resamples was performed. For each resample, the model coefficients were re-estimated, and the optimism in the goodness-of-fit measures was evaluated. The bootstrap-corrected (R2) values were 0.72 and 0.73 for the quasi-static and impact branches of (DIFk,initial), respectively, and 0.65 and 0.70 for the corresponding (DIFk,avg) relationships. The corresponding bootstrap-corrected MAPE values were shown in Table 8. The MAPE of 26% indicates a notable deviation between the analytical and experimental inertia-force estimates, highlighting the limitations of the simplified acceleration distribution adopted in the analytical approach. This discrepancy may be associated with the spatially and temporally nonuniform dynamic response, including local acceleration variations and crack development. Therefore, the analytical approach should be considered an approximate estimation method rather than a highly accurate predictive model. Importantly, the experimentally determined inertia forces, rather than the analytical estimates, were used in the subsequent analyses.
These results indicate relatively stable internal performance for most model branches, whereas the quasi-static (DIFk,avg) relationship exhibits greater uncertainty. Accordingly, the proposed expressions should be regarded as empirical relationships applicable within the investigated experimental range, and independent validation is required when suitable external datasets become available. As summarized in Table 8, the results indicate that the proposed formulations predict both the initial and average flexural stiffness with satisfactory accuracy in both quasi-static and impact regimes. The initial stiffness (DIFk,initial) shows consistently lower prediction errors, reflecting the stable and primarily elastic nature of the pre-cracking response, which is less sensitive to local variations and dynamic effects. In contrast, the prediction errors for the average stiffness (DIFk,avg ) are noticeably higher. This is expected because kavg captures the structural response up to peak load and is influenced by several rate-dependent mechanisms, such as fiber engagement, bond-slip behavior, crack localization, crack branching, and inertia-modified deflection, which introduce greater variability into the experimental data. The peak load and corresponding deflection are also more sensitive to measurement uncertainties during impact loading, further contributing to the increased error. Despite these complexities, the proposed relationships still demonstrate strong overall agreement with the experimental results, confirming their capability to represent the strain-rate-dependent stiffness behavior of SFRC beams.
These results indicate that the proposed formulations are capable of reproducing experimental stiffness values with a high degree of accuracy, confirming their effectiveness in capturing the strain-rate dependence of SFRC flexural behavior. The ability to predict stiffness consistently across both quasi-static and impact loading regimes demonstrates that the observed dynamic stiffening arises from the combined effects of matrix rate sensitivity, improved fiber–matrix interaction, and inertia-regulated deformation. Collectively, these mechanisms govern how SFRC beams respond under high strain rate loading and explain the progressive increase in both initial and average stiffness with strain rate. The findings underscore the need to explicitly account for rate-dependent flexural stiffness in the analysis, modeling, and design of SFRC elements intended to resist impact or other high-rate loading scenarios.
To assess the physical consistency of the proposed stiffness DIF, Figure 15 compares its strain-rate dependence with the experimental DIFs of compressive strength [14], tensile strength [22], and fracture energy [16] reported in previous studies. Importantly, all datasets correspond to SFRC with the same mix proportions and material constituents as those adopted in the present study, providing a consistent basis for comparison and minimizing the influence of differences in mixture composition. A comparison with the elastic-modulus DIF was not included because corresponding experimental data were unavailable. As shown in Figure 15, the investigated mechanical properties exhibit different degrees of rate sensitivity; nevertheless, they show a common tendency toward increasing DIF with strain rate, with the enhancement becoming more pronounced in the impact regime. The proposed flexural stiffness DIFs follow the same general trend, supporting the physical consistency of the experimentally observed dynamic stiffness enhancement with the established rate-dependent behavior of the SFRC material. Direct equivalence between the different DIFs is not expected because they characterize different aspects of the response. The compressive- and tensile-strength DIFs quantify the rate-dependent enhancement of material resistance, whereas the fracture-energy DIF characterizes the energy associated with fracture and crack propagation. In contrast, (DIFk,initial) characterizes the initial, predominantly uncracked flexural response, while (DIFk,avg) represents the overall pre-peak load–deformation response and additionally incorporates progressive cracking and fiber engagement. Therefore, the comparison indicates that the observed stiffness enhancement is consistent with the broader rate sensitivity of SFRC while representing a distinct aspect of its dynamic response.
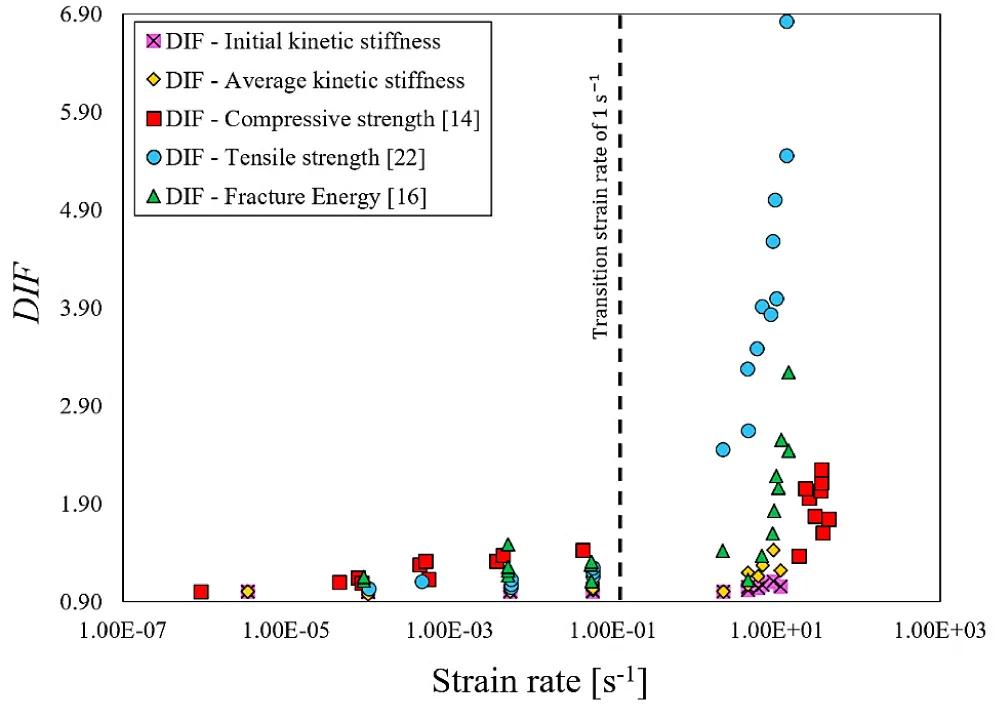
Figure 15: Comparison of the proposed flexural stiffness DIFs with experimental DIFs of compressive strength [14], tensile strength [22], and fracture energy [16] for SFRC with the same mix proportions.
It is worth mentioning that the influence of specimen size and structural scale should also be considered when interpreting the present results. The dynamic flexural response and inertia forces depend on parameters such as member dimensions, span length, mass distribution, and loading configuration. Therefore, the stiffness trends and empirical DIF relationships obtained from the 100 × 100 × 400 mm³ specimens investigated herein should not be directly extrapolated to full-scale structural members. Further experimental and numerical studies covering different specimen sizes and structural scales are required to evaluate size effects and establish the broader applicability of the proposed relationships.
In addition, the present findings should be interpreted considering the limitations of the experimental program. Although the stiffness parameters were determined using support reaction forces, the measured dynamic response may still be influenced by inertia and stress-wave propagation. Furthermore, the proposed DIF relationships are based on three specimens per loading condition, a fixed beam geometry, and an SFRC mixture containing 1% steel fibers. The transition strain rate of 1 s-1 was adopted rather than experimentally established, and no measurements were obtained near this boundary. Therefore, the proposed relationships should be limited to the investigated material, geometry, and tested strain-rate ranges, while their broader applicability requires further validation.
This study experimentally examined the flexural response of steel fiber–reinforced concrete (SFRC) beams over a broad range of strain rates, with particular emphasis on the rate-dependent flexural stiffness under quasi-static and impact loading conditions. A comprehensive series of three-point bending tests including both quasi-static loading and instrumented drop-weight impact tests was performed to quantify the influence of strain rate on the initial kinetic stiffness and the average kinetic stiffness of SFRC beams.
The results clearly demonstrate that the flexural response of SFRC is strongly rate dependent. Both the initial stiffness (k,initial) and the average stiffness (kavg) increased as the strain rate rose, with the most significant enhancement occurring at strain rates above roughly 1 s-1, corresponding to the adopted transition between the quasi-static and impact regimes.
The strain-rate effect manifested differently across the pre-cracking and pre-peak stages. In the uncracked region, stiffness amplification may be associated with the matrix modulus and early inertia effects. As cracking progressed toward peak load, the stiffness enhancement may also be associated with fiber-bridging mechanisms.
The coefficient of variation for fft across all strain-rate levels ranged from 0.2% to 13.5%, indicating good repeatability of the experimental results. Additionally, the inertia-to-impact load ratio remained nearly constant at approximately 0.6 throughout the impact regime, reflecting a stable relationship between inertia effects and the overall dynamic response.
New empirical formulations were developed to predict the dynamic increase factors (DIF) of both initial and average flexural stiffness. As no prior models exist in the literature for strain-rate-dependent stiffness of SFRC beams, the proposed relationships represent the first attempt to characterize this behavior. Statistical evaluation using R², MAD, and MAPE confirmed that the proposed expressions reproduce the experimental stiffness values with high accuracy across the full range of loading rates.
Overall, the findings highlight that flexural stiffness in SFRC beams is highly rate-sensitive and may be associated with the combined contributions of matrix elasticity, fiber bridging, and inertia. However, the individual contributions of these mechanisms cannot be quantitatively distinguished from the present experimental results. The observed dynamic stiffening behavior underscores the necessity of explicitly incorporating strain-rate-dependent stiffness in the design and analysis of SFRC elements subjected to impact or other high-rate loading conditions. The proposed models and experimental insights provide a foundation for more reliable performance assessment and improved design strategies for protective concrete structures.
Acknowledgment
The authors also acknowledge the institutional support of ISISE – Institute for Sustainability and Innovation in Structural Engineering, University of Minho.
Funding
This work was supported by the Portuguese Foundation for Science and Technology (Fundação para a Ciência e a Tecnologia, FCT) through the doctoral research grant SFRH/BD/149246/2019.
- Othman H, Marzouk H. An experimental investigation on the effect of steel reinforcement on impact response of reinforced concrete plates. Int J Impact Eng 2016;88:12–21. Available from: https://doi.org/10.1016/j.ijimpeng.2015.08.015
- Bakhshi M, Barros JAO, Rezazadeh M, Valente IB, Ramezansefat H. A novel analytical framework for assessing the impact response of SFRC beam. Int J Impact Eng 2023;182:104768. Available from: https://doi.org/10.1016/j.ijimpeng.2023.104768
- Bakhshi M, Valente IB, Ramezansefat H, Barros JAO. Evaluation of the inertia force in compressive impact loading on steel fiber-reinforced concrete. RILEM-fib Int. Symp. Fibre Reinf. Concr., Springer; 2021: 277–88. Available from: https://doi.org/10.1007/978-3-030-83719-8_25
- Hassanshahi O, Majid TA, Lau TL, Yousefi A, Tahara RMK. Seismic performance of the typical RC beam–column joint subjected to repeated earthquakes. AIP Conf. Proc., vol. 1892, AIP Publishing LLC; 2017; 120014. Available from: https://doi.org/10.1063/1.5005755
- Yousefi A, Bunnori NM, Khavarian M, Hassanshahi O, Majid TA. Experimental investigation on effect of multi-walled carbon nanotubes concentration on flexural properties and microstructure of cement mortar composite. AIP Conf. Proc., vol. 1892, AIP Publishing LLC; 2017; 20032. Available from: https://doi.org/10.1063/1.5005663
- Banthia NP, Mindess S, Bentur A. Impact behaviour of concrete beams. Mater Struct 1987;20:293–302.
- Ulzurrun G, Zanuy C. Flexural response of SFRC under impact loading. Constr Build Mater 2017;134:397–411. Available from: https://doi.org/10.1016/j.conbuildmat.2016.12.138
- Zanuy C, Ulzurrún GSD. Rate effects of fiber-reinforced concrete specimens in impact regime. Procedia Eng 2017;193:501–8. Available from: https://doi.org/10.1016/j.proeng.2017.06.243
- Yoo DY, Yoon YS, Banthia N. Flexural response of steel-fiber-reinforced concrete beams: Effects of strength, fiber content, and strain-rate. Cem Concr Compos 2015;64:84–92. Available from: https://doi.org/10.1016/j.cemconcomp.2015.10.001
- Bakhshi M, Ramezansefat H, Rezazadeh M, Valente I, Barros JAO. An analytical approach for evaluating the impact response of steel fiber reinforced concrete beam. Proc. 3rd RILEM Spring Conv. Conf. Vol. 1 Strateg. a Resilient Built Environ. 3, Springer; 2021: 15–30. Available from: https://doi.org/10.1007/978-3-030-76547-7_2
- Bakhshi M, Valente IB, Ramezansefat H, Barros JAO. Maximum Midspan Acceleration of Steel Fiber-Reinforced Concrete Beams Under Impact Loading. FIB Int. Conf. Concr. Sustain., Springer; 2024, p. 506–14.
- Azimi N, Oliveira DV, Ghiassi B, Dalalbashi A, Lourenço PB. Evaluation of creep effects on textile-reinforced mortar via single-lap shear testing. Constr Build Mater 2025;497:143897. Available from: https://doi.org/10.1016/j.conbuildmat.2025.143897
- Yoo DY, Banthia N. Impact resistance of fiber-reinforced concrete–A review. Cem Concr Compos 2019;104:103389. Available from: https://doi.org/10.1016/j.cemconcomp.2019.103389
- Bakhshi M, Valente IB, Ramezansefat H, Barros JAO, Pereira ENB, Peixinho NRM. Experimental and analytical study of the high-strain-rate compressive behavior of SFRC. Mech Adv Mater Struct 2023:1–24. Available from: https://doi.org/10.1080/15376494.2023.2199420
- Bakhshi M, Valente IB, Ramezansefat H. New model for evaluating the impact response of steel fiber reinforced concrete subjected to the repeated drop-weight. Constr Build Mater 2024;449:138459. Available from: https://doi.org/10.1016/j.conbuildmat.2024.138459
- Bakhshi M, Valente IB, Ramezansefat H, Barros JAO, Pereira ENB, Peixinho NRM. Experimental and analytical study of the high-strain-rate flexural behavior of SFRC. J Mater Civ Eng 2023. Available from: https://doi.org/10.1061/JMCEE7.MTENG-16559.
- Ramezansefat H, Rezazadeh M, Barros JAO, Valente IB, Bakhshi M. Modeling the Compressive Behavior of Steel Fiber Reinforced Concrete Under High Strain Rate Loads. Fibre Reinf. Concr. Improv. Innov. RILEM-fib Int. Symp. FRC 2020 10, Springer; 2021; 703–13. Available from: https://doi.org/10.1007/978-3-030-58482-5_63
- Ramezansefat H, Rezazadeh M, Barros J, Valente I, Bakhshi M. Modelling the High Strain Rate Tensile Behavior of Steel Fiber Reinforced Concrete Using Artificial Neural Network Approach. Int. Conf. Fibre-Reinforced Polym. Compos. Civ. Eng., Springer; 2021; 1099–109.
- Hassanshahi O, Salati M, Azimi N, Bakhshi M. Hybrid Steel Fibers and RCA in RCC Pavements: Mechanical Recovery, Freeze–Thaw Durability, and Eco-Efficiency. Infrastructures 2025;10:321.
- Hassanshahi O, Karimzadeh S, Bakhshi M, Azimi N. Synergistic Role of Recycled Concrete Aggregates and Hybrid Steel Fibers in Roller-Compacted Concrete Pavements: A Multi-Criteria Assessment for Eco-Efficiency Optimization. Buildings 2025;15:4279.
- ACI Committee 544. Report on Measuring Mechanical Properties of Hardened Fiber Reinforced Concrete 2017.
- Bakhshi M, Valente IB, Ramezansefat H, Barros JAO. Effect of inertia and test approach on the high-strain-rate tensile behavior of steel fiber reinforced concrete. Cem Concr Compos 2025:106095.
- Bakhshi M, Valente IB, Ramezansefat H, Barros JAO. Evaluation of inertia force and maximum midspan acceleration in steel fiber reinforced concrete beam at high-strain rates. Cem Concr Compos 2025:106384. Available from: https://doi.org/10.1016/j.cemconcomp.2025.106384
- Bakhshi M, Valente IB, Ramezansefat H, Barros JAO, Pereira ENB, Peixinho NRM. Experimental investigation of the effect of high strain rate loading on the flexural behaviour of the steel fibre-reinforced concrete. Fib Symp 2021;2021-June:604–13.
- Qin Z, Zheng D, Li X, Wang H. Influence of Inertia on the Dynamic Compressive Strength of Concrete. Materials (Basel) 2022;15:7278.
- Wang Z, Ma G, Ma Z, Zhang Y. Flexural behavior of carbon fiber-reinforced concrete beams under impact loading. Cem Concr Compos 2021;118:103910. Available from: https://doi.org/10.1016/j.cemconcomp.2020.103910
- Wu M, Chen Z, Zhang C. Determining the impact behavior of concrete beams through experimental testing and meso-scale simulation: I. Drop-weight tests. Eng Fract Mech 2015;135:94–112. Available from: https://doi.org/10.1016/j.engfracmech.2014.12.019
- Azimi N, Schollbach K, Oliveira D V, D’Antino T, Lourenço PB. Durability of natural hydraulic lime–pozzolan mortars for TRM strengthening systems under acidic aging: Linking microstructural degradation to mechanical performance via chemo-mechanical modeling. Constr Build Mater 2025;500:144244. Available from: https://doi.org/10.1016/j.conbuildmat.2025.144244
- Hassanshahi O, Kameli S, Mohammadpour R, Bakhshi M, Mahboob A. Experimental Investigation of Sustainable Roller-Compacted Concrete Pavement (RCCP) Reinforced with Natural Fibers: Mechanical Performance, Durability, and Environmental Impacts. Int J Pavement Res Technol 2025:1–24.
- Banthia N, Gupta P, Yan C. Impact resistance of fiber reinforced wet-mix shotcrete part 1: Beam tests. Mater Struct 1999;32:563–70.
- Malvar LJ. Review of static and dynamic properties of steel reinforcing bars. Mater J 1998;95:609–16.
- Lok TS, Zhao PJ. Impact response of steel fiber-reinforced concrete using a split Hopkinson pressure bar. J Mater Civ Eng 2004;16:54–9.
- CEB-FIP. Model code 2010. Com Euro-International Du Bet 2010.
- CEB-FIP. Design code 1990. Com Euro Int Du Bet 1990:51–9.
- Ghomian M, Dehestani M, Garshasbi S, Azimi N. Optimizing fracture resistance in steel fiber-reinforced self-consolidating concrete: Insights from mode II and mode I fracture energy analysis. Structures, Elsevier; 2025; 75: 108707. Available from: https://doi.org/10.1016/j.istruc.2025.108707
- Othman H, Marzouk H, Sherif M. Effects of variations in compressive strength and fibre content on dynamic properties of ultra-high performance fibre-reinforced concrete. Constr Build Mater 2019;195:547–56. Available from: https://doi.org/10.1016/j.conbuildmat.2018.11.093
- Zhang XX, Abd Elazim AM, Ruiz G, Yu RC. Fracture behaviour of steel fibre-reinforced concrete at a wide range of loading rates. Int J Impact Eng 2014;71:89–96. Available from: https://doi.org/10.1016/j.ijimpeng.2014.04.009
- Wang S, Zhang MH, Quek ST. Effect of specimen size on static strength and dynamic increase factor of high-strength concrete from SHPB test. J Test Eval 2011;39:898–907. Available from: https://doi.org/10.1520/JTE103370
- Chen C, Geng P, Yang Q, Zhao Y, Gu W, He C, et al. Dynamic constitutive modeling of steel fiber reinforced concrete considering damage evolution under high strain rate. Constr Build Mater 2024;440:137433.
- Sun X, Zhao K, Li Y, Huang R, Ye Z, Zhang Y, et al. A study of strain-rate effect and fiber reinforcement effect on dynamic behavior of steel fiber-reinforced concrete. Constr Build Mater 2018;158:657–69. Available from: https://doi.org/10.1016/j.conbuildmat.2017.09.093
- ACI Committee 544. State-of-the-art report on fiber reinforced concrete 1996.
- Wang S, Zhang M-H, Quek ST. Effect of high strain rate loading on compressive behaviour of fibre-reinforced high-strength concrete. Mag Concr Res 2011;63:813–27.
- Barros JAO, Costa IG, Frazão CM V, Valente TDS, Lourenço LAP, Melo FJSA. Innovative prefabricated lightweight slab system of high structural performance. Eng Struct 2022;259:114146.
- Barros JAO, Valente TDS, Costa IG, Melo FJSA. Integrating Hybrid Reinforced Concrete Technology and Advanced FEM-Based Numerical Modelling for Crack Control in Long Concrete Foundations Without Joints. RILEM Int. Conf. Numer. Model. Strateg. Sustain. Concr. Struct., Springer; 2022; 33–46.
- Tlemat H, Pilakoutas K, Neocleous K. Flexural toughness of SFRC made with fibres extracted from tyres. Proc. Int. Symp. Adv. Waste Manag. Recycl. (in Recycl. Reuse Waste Mater. Dundee, 2003, p. 365–74.
- B E. 12390‑4. Testing hardened concrete–Part 4 : Compressive strength – Specification for testing machines. Br Stand Inst London, UK 2019.
- En BS. 12390-13. Testing hardened concrete–Part 13: determination of secant modulus of elasticity in compression. Br Stand Inst London, UK 2013.
- EN BS. 14651: 2005+ A1: 2007. Test method for metallic fibre concrete–Measuring the flexural tensile strength (limit of proportionality (LOP), residual). Br Stand Inst London, UK 2005.
- Bakhshi M, Azimi N, Hassanshahi O. Effect of Strain Rate on the Energy Dissipation Capacity of Steel Fiber Reinforced Concrete Beams. J Build Eng 2026:115527. Available from: https://doi.org/10.1016/j.jobe.2026.115527
- Zhu Yan-yan. Numerical Simulation on Impact Resistance of Steel-fiber Reinforced Concrete. Eng Mater Sci 2007.
- Rasheed MA, Prakash SS. Behavior of hybrid-synthetic fiber reinforced cellular lightweight concrete under uniaxial tension–Experimental and analytical studies. Constr Build Mater 2018;162:857–70.
- Park JK, Kim SW, Kim DJ. Matrix-strength-dependent strain-rate sensitivity of strain-hardening fiber-reinforced cementitious composites under tensile impact. Compos Struct 2017;162:313–24.
- Banthia N, Mindess S, Bentur A, Pigeon M. Impact testing of concrete using a drop-weight impact machine. Exp Mech 1989;29:63–9. Available from: https://doi.org/10.1007/BF02327783
- Bentur A, Mindess S. Fibre reinforced cementitious composites. Crc Press; 2006.